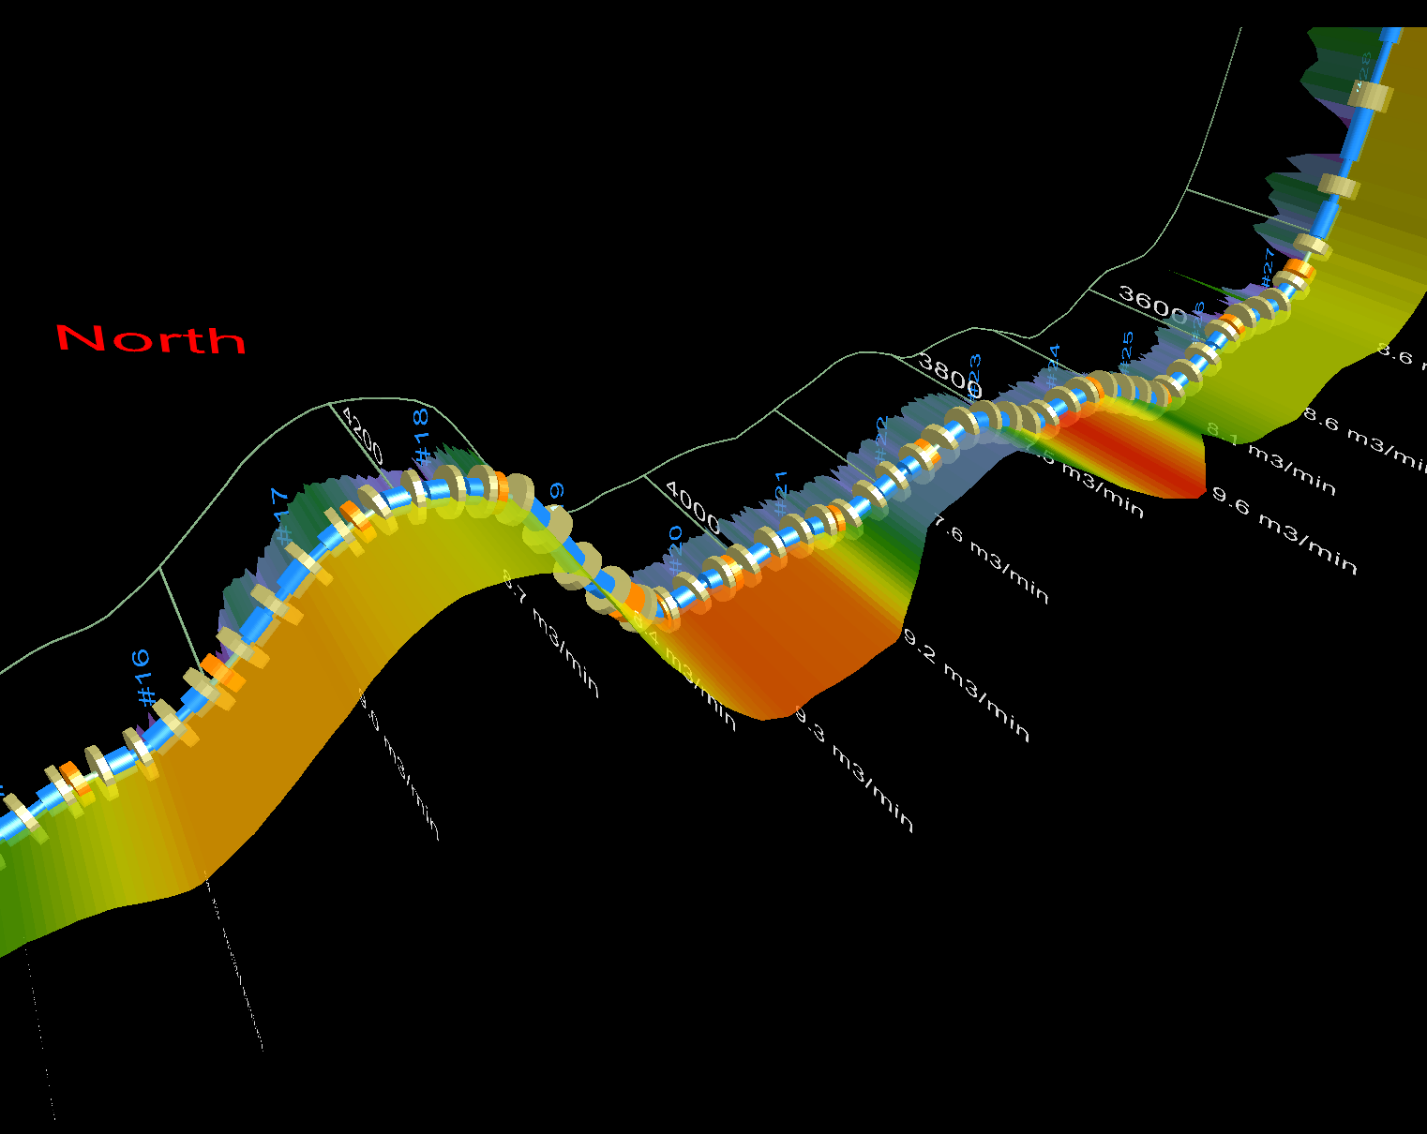
Trajectory View displays the wellbore including a gamma ray digital curve, casing pipe segments, perfs and Frac objects, Frac program results, and formation tops.
The Trajectory View tab shares some of the existing Profile Viewer functionality available in other tabs and in the pane to the right of the display pane. For example, you can add or edit downhole completions using the Profile Viewer Completions tab, which automatically appears in the Trajectory View tab. Likewise, you can change log definitions for the gamma ray curve using the Digital Logs pane to the right of the display pane, and increase the Viewport setting to accentuate subtleties of the wellbore trajectory.
Casing segments are broken into virtual segments that may not duplicate the actual casing pipe segmentation. Virtual casing segments are generated using a methodology based on casing interval, casing diameter, and directional survey.
The wellbore appears in the Trajectory View tab display pane.
The point clicked is centered in the display pane, and the North and South markers move alongside it.
A high-degree of rotation control is possible by zooming in significantly, and then clicking a new point to define a more precise rotation center point each time that you adjust the wellbore angle of rotation.