Contouring Maps
Contouring in AccuMap is done using Surfer by Golden Software, which you install separately. After installing Surfer, launch it so that AccuMap can detect it. In the future, when you select contouring mode in AccuMap, Surfer launches automatically. For information about acquiring Surfer, see the www.goldensoftware.com website.
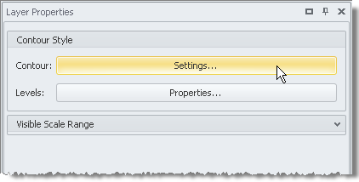
Each separate contour drawn appears in the Layer Legend. The Layer Legend can be used to configure and either display or hide a contour layer. The Contour Settings and the Contour Properties dialog boxes referenced in the procedure below can be used to modify an existing contour layer by first selecting the layer to modify in the Layer Legend, and then clicking Settings to the right of the Contour label in the Contour Style pane, and Properties to the right of the Levels label.
When contouring using tops, if directional surveys are licensed, the XY coordinates are drawn from there. If directional surveys aren't licensed, AccuMap interpolates between the surface and bottom hole relative to the formation TVD and the borehole TVD.
Click for a list of the AccuMap supports.
To contour Maps
- Using the Ribbon toolbar, with the Contouring tab displayed, click Create (
 ).
).
The dialog box appears.
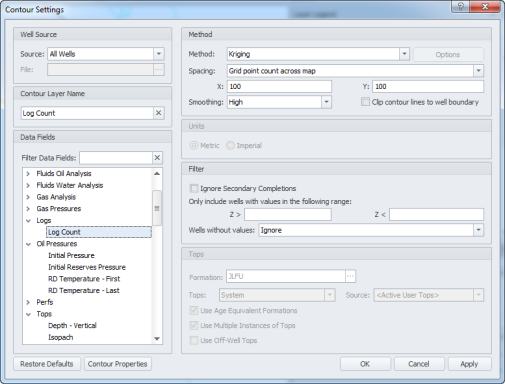
- Select the filtering source that specifies the contoured wells. For example, select All Wells to retrieve data for all of the items in the current map extents. Select Well List or CSV/Core Post File to limit contour data retrieval to only those items within a well list, CSV, or core posting file.
- Type a layer name that appears in the Layer Legend that can be used to control the display and inspection of the contour layer.
- Select the data field to contour. Type the contiguous characters in a data field to filter the Data Fields display pane.
- Select a contouring method and contouring details based on the following:
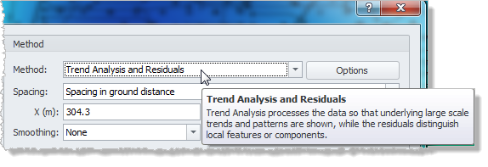
- Method - For a summary of the key features of a contouring method, with that method displayed in the Method drop-down list, hover the cursor over the drop-down arrow as depicted below.
- Spacing - whether spacing for the base contour grid uses a specific number of points that you define, or uses the underlying map extents. Specify a lower number of X Y points than available in the map to generate a quick preview of the contour map. Specify a higher number of XY points to compensate for an underlying map that doesn't have many data points.
- X Y - when Grid point count across map is selected above, type the number of X and Y data points that define the contour base map. Generally, it's best to specify the same number of data points for both X and Y options.
- Smoothing - specifies the number of contour interpolation points to insert between two actual contour points where None = 0, Low = 1; Medium = 2; and High = 3. Monitor resolution, map extents, and grid density control the amount of smoothing that's possible. A high resolution monitor displaying a large map with a dense grid makes higher curvature possible, as there are more data points to work with and less interpolation is required. However, these factors also increase the time that it takes to render contours. The type of gridding method selected also affects the degree of smoothing.
- Clip contour lines to well boundary - when a well list is specified as the data source in the Well Source pane in the top-left of the Contour Settings dialog box, specify that contour lines are only generated from these extents. If the Clip contour lines to well boundary option is cleared, the contour lines and fill extends across the map beyond the extents of the Source well list.
- Click Contour Properties in the bottom-left of the Contour Settings dialog box to display the dialog box where you apply line, label, and fill settings. Launching this dialog box from the Contour Settings dialog box enables you to make changes before the contouring is applied, which can be time consuming for large areas.
- Click Apply to see the contour settings applied to the map without dismissing the Contour Settings dialog box so that you can make additional changes before dismissing the Contour Settings dialog box.
Contouring is applied to the map, and the new contour layer appears in both the Layer Legend under the Contours group, and also in the drop-down list to the right of the Create () button in the Contouring tab.
To prevent the map from recontouring every time you change some facet of the grid (by moving the map, changing the data set, or changing control points, or included wells), ensure the Auto Regrid button ( ) that appears in the Contouring tab is not highlighted, and click Regrid (
 ) whenever you want to recontour.
- Create additional contour layers using different contour options or different data types by repeating the above steps.
OR
To change options selected in the Contour Settings dialog box above, using the Layer Legend, select the contour layer to change and in the Layer Properties pane in the bottom portion of the Layer Legend, to the right of the Contour label, click Settings.
The dialog box shown above appears.
- Using the Layer Properties pane that appears at the bottom of the Layer Legend, to the right of the Levels label, click Properties.
The dialog box appears.

- Change the lines, labels, and fills applied to a contour layer as follows:
- Lines - specify min/max display properties. The Minor Interval is typed directly in the box. The Major Interval must be selected using the drop-down list and the increments that can be selected are a result of the Minor Interval specified. Type a specific value to which to apply highlight properties in the Highlight box. To highlight multiple values, type the values in the Highlight box separated by commas (spaces after commas optional).
- Labels - select the increments with which to display labels for measurement intervals. The frequency with which labels can be displayed are a multiple of the Minor Interval set above. For example, if the minor interval is 25, labels can be displayed in increments of 25 (25, 50, 75).
- Cutoff Values - select the range within which contour lines appear.
- Fills - select the initial palette to work with from the Palette drop-down list in the bottom-right of the Fills pane, and then configure the color palette by either dragging an existing node that appears below the color gradient strip to the data value at which the color is applied. When you click the node, a color box appears below the node and the actual data value at which that color is applied appears above the color gradient strip (as depicted below). Type a specific value in the box above the color gradient strip or simply drag the node that appears below the strip.

To remove a color thus reducing the palette color range, drag the node away from the color strip. To flip the min-max colors, click the left-most node and in the box that appears above the gradient strip, type the value applied to the right-most node, which is visible in the max Stop box to the right of the color strip. Now, click the right-most color node and type the min value that appears in the Start box. Select Solid Fill to start and end colors at the major or minor interval line. Select Gradient Fill to blend colors outside of the major and minor interval line.
- To save a customized contour palette so that it's available in future AccuMap sessions, in the bottom-right of the Fills pane, click Save or Save As. The file name of the palette is prefixed by U- in the Palette drop-down list to indicate it is a user-generated file.
- To delete a contour, using the Active Contour Layer of the Contouring tab that appears in the Ribbon, click Delete (
 ). Note, however, that instead of deleting a contour, prevent it from appearing on the map by clearing the visibility check box for that contour layer using the Layer Legend as depicted below. This way the contour will remain available for other AccuMap sessions.
.png)
- Click Lock Contours (
 ) to freeze contoured area so that you can either save the map to disk, or so that you can navigate away from the current center point or map extents without losing the contoured area. The contour is pinned to the actual wells upon which it is based, and if you've defined control points using the Add/Move Control Points (
 ) option or included and excluded (
 ) certain wells , that information is saved too. Included wells are circled green (
 ); excluded wells are circled gray (
 ).
).
When you reopen the map, the area is recontoured using the latest data for the wells you've specified.
 Related Topics