Correlating Logs
Correlation Module enables you to compare single or multiple wells against a reference well, pick formation tops, markers, and reservoir layers. It includes several advanced features, specially focused on modern horizontal and multi-stage fracking workflow issues. You can flatten wells on selected strata, expose the well leg, and then gradually Split Up legs to compare logs and completions.
Here is the Duvernay wells with inspectable GR and GAS logs:

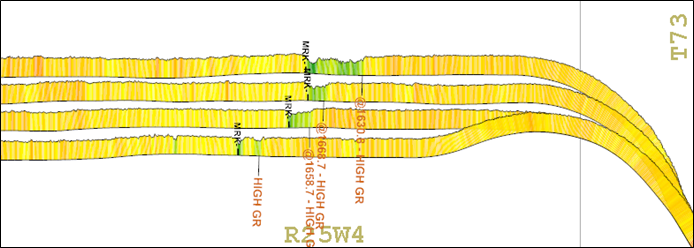
To render horizontal wells in vertical Correlate View, Correlation Module uses weighted True Horizontal Displacement (THD) function a.k.a. Stretch Plot. Stretch Factor controls the curvature of the borehole approaching the landing point. The Spatial View tab displays the following: land grid, digital logs, multi-stage fracs, tops, markers, and anchored labels created in the correlate view, which can be used to mark laterally correlated spatial objects. If you are licensed for frac data, on-the-fly generated frac curves can be rendered along the borehole in both views (injection rate, treatment pressure, etc.).
The Nearby Area minimap enables you to compare a selected offset well against a reference well, or to build cross sections initiated from the reference well. Several ways exist to pick formation tops and markers. Just drag-drop a top from one well to another, or use the pick list in the left pane to pick across. Auto-named tops and markers are helpful for quickly placing picks on an unknown surface and setting the name later (right-click the existing user pick to rename it).
The Laterally Compressed option fits more wells in the viewport.

Reservoir Layers can be used to show anything that has a top and base (for example CRDM Tight, SSPK Brittle etc.). While you are picking layers, Correlation Module saves the total TVD thickness of each well in the Stats.csv file in a corresponding user data folder (for example UserDataFolder\CorrelationUserData\GeoLayers\SSPK BRITTLE\Defs\Stats.csv). You can point the AccuMap Main Map to this file to post or contour total thickness.
Log Usage Mode includes: Digital else Raster, Digital Only, or Raster Only. Correlation Module enables you to batch link multiple proprietary LAS files to corresponding database wells. By default, Correlation Modulation displays proprietary wells and logs first, and only where they don't exist, downloads them from the S&P Global Inc. Information Hub.
You must be licensed for directional surveys, geology, and tops in order to access Correlation Module. Licensing for Frac and logs is optional. For example, you may intend to use proprietary logs.
To correlate logs
- Launch the Correlation Module (
 ) from the well to which to compare one or multiple wells using either of the following options:
- While inspecting the map, right-click the well and select Correlation Module from the context menu.
- From the DataCard, select the desired well in either the My Items or the Area Wells tabs and in the Viewers group, click Correlation Module.
- With a cross section selected using the Cross Sections tab in the main ribbon, from the Launch group, click Correlation Module.
- With a well list selected using the Lists/Selections tab in the main ribbon, from the Tools group, click Correlation Module.
The dialog box appears with the reference welll on the left and a default well on the right.To change the default well, using the Nearby Area pane, double-click the well to replace it with.
To add multiple wells to the display pane, in the Nearby Area pane, click Create X-Section, and then click the well header of the wells to include. Double-click the last well you select to end cross section mode and to display the cross section in the display pane.
To narrow the selection in the Nearby Area minimap, select a formation name in the Wells by Proj Form drop-down list of the Home tab, and whether to display only wells with digital logs. Roll the mouse wheel to zoom in or out in the minimap. Right-click a well in the minimap and select Set as Reference Well in the context menu.
- Using the tab, place the following types of markers along the wellbore:
- Pick Tops - click Auto Name and drop one or more tops on the log that you may later rename by right-clicking the top and selecting Rename User Formation from the context menu. The auto named tops are automatically written to the user database of tops. Click Select Formation to display the Select Formation dialog box from which you select an existing formation top. Refer to the Warping Path and Apparent Dip panes to see that tops correlate to the trend shown in those panes. Where a top does not follow the trend line indicated in the Warping Path pane, drag the top that appears in the wellbore, or in the Warping Path or Apparent Dip panes. The formation top is updated in all locations: the display pane, Warping Path, and Apparent Dip panes.
- Pick Markers - click to display the Select Marker dialog box from which you select a marker created prior using the Auto Name feature. Click Auto Name to drop multiple markers on one or more logs. These can be renamed by clicking the marker and selecting Rename Marker from the context menu.
- Create Reservoir Layers - click Define New to display the Add Geo Layer Type name dialog box, where you type a name for the new layer, and then specify a fill color. Click Pick Layers and then place the top and then the bottom of the reservoir layer on the well log. To end the reservoir placement, double-click when placing the bottom of the reservoir. Otherwise, place additional reservoirs by clicking the top and bottom of the reservoir on either this or adjacent wells. When the layer you created is selected in the Active Layer drop-down list, the wellheads of wells in which that layer is picked are encircled on the minimap. Layers are not written to the user tops database.
Layers are written to the Stats.csv file located in the AccuMap/CorrelationUserData/GeoLayers/Layer1/Defs folder. You can post and contour using this layer in AccuMap.
- Using the tab, in the Active Datum group, select a formation on which to datum.
OR
Right-click the top on which to datum directly on the log and select Set as Datum from the context menu. You must select a datum before you can use options in the Horizontal Options group.
If you shift the wells vertically by dragging along the vertical portion of the wellbore and want to reset the depth using the datum selected in the Select Active Datum drop-down list, click Apply Datum.
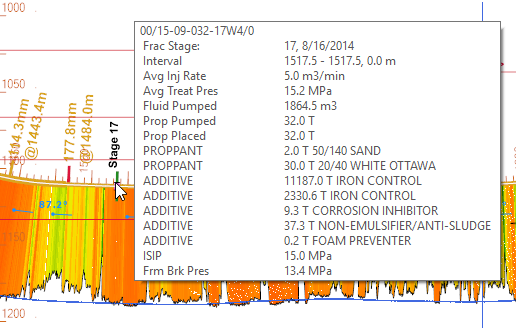
- Using the tab, select your log and scale preferences. To determine whether a log displayed in the Correlation Module window is from the S&P Global Inc. Data Hub or a proprietary log, hover your cursor over the shaded curve outline to display a popup window. Right-click a proprietary curve outline to detach the proprietary LAS.
- Using the Digital Log Curve group, specify the logs to display in the left and right tracks and whether a reference line appears. The reference line is set using the Definitions (
 ) option in the Definitions & Properties group to launch the dialog box.
- Using the Horizontal Options group, click Expose Leg. Specify a stretch factor to define the curvature of the borehole where it approaches the landing point for all wells in the display pane.
- Using the Hrz. Alignment drop-down list, select Align Wellheads to overlap the vertical portions of the wellbore
OR
Select Laterally Compressed to reduce the space between wellbores.
- Using the Vert. Alignment drop-down list, select Split Up to offset the horizontal legs from each other and compare logs and completions. You can also drag the vertical portion of the wellbore to move the well up or down in relation to other wellbores that appear in the display pane.
- Hover the cursor over portions of the well log to see details about objects (digital log, borehole, completion, frac, etc.) above which you hover.
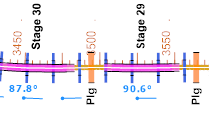
If licensed for Frac information, along the wellbore in a completion zone blue arrows indicate perf clusters, pink borehole regions indicate stages, and orange bars indicate plug backs. Details on these items can be posted using the Wellbore & Fracs tab, mentioned below.
- Using the tab, click Add and then click the location along the wellbore where to place an annotation. You can change the orientation and the offset of the label, and whether to display a depth prefix. Select an annotation to remove and click Delete, or clear the Show option in the Actions group to temporarily hide all annotations. There are a number of options than can be displayed using the tab.
- To view a bird's-eye spatial view, in the bottom-left of the Correlation Module window, below the Pick List, click Spatial View, which activates the Spatial View tab. Click whether to Load All logs or just view the logs already downloaded for your area, and post data along the wellbore.
- To link to proprietary LAS files, using the Logs tab, link either directly to a proprietary LAS file or to a folder of LAS files using the Proprietary LAS group. Once imported, the wellhead symbol of wells in the minimap that are associated with LAS files are colored red.
- To use the Pick List, select a list of tops where AOI are all tops that appear at any depth in the minimap, and Correlation are only tops that appear in at least one well in the display pane. You can create your own list of tops or change the tops that appear in either the AOI or Correlation templates by clicking
 to display the Pick List Editor. You can also create a customized list of tops that includes markers you created and save it as a Tops Template that is then available from the drop-down list in the main Correlation Module window.
Using the Pick List, click a top to place along a wellbore, then move the cursor to the desired location in the wellbore and click to place the top. Right-click to exit pick mode.To select a top that doesn't appear in the Pick List, use the Pick Tops tab, Pick Tops group. The details of any formation tops you pick or adjust in the display pane are written to your user tops database.
- With either the Correlate View or the Spatial View selected as the desired view in the current window, using the tab, click Page Setup to display the Page Setup dialog box, with which you configure print properties. Click Print to output the view displayed in the Print Preview dialog box.
 Related Topics