Viewing Incident Details
Query and inspect current and historic incident information. View incident history for individual items while in Inspect mode, or make a list (facility, pipeline, well, or incident) that contains items for which to display incidents.
Using Incident Manager, display information for individual incidents in a grid that can be filtered and sorted. Grid items are summarized and plotted in a pie or bar chart to uncover trends. Grid information can be exported to Microsoft Excel or CSV format for further processing. Print or save details for an individual incident as a PDF.
Incident information is displayed in the Incident Manager DataCard as follows:
Incidents are two separate map layers under the Incidents group that appears in the Map Layers pane: Complaint, and Release incidents, which enables different symbology to be selected for each.
Viewing incident details
- Display incidents using Inspect mode, or based on a list (facility, pipeline, well, or incident) as follows:
- Inspect mode - using the Layer Legend, enable Inspect (
 ) for the Incidents layer, and then using the Data tab in the Main ribbon, enable Inspect Mode (
 ), and then click the incident on the map for which to display incident details.
- List mode - using the Lists tab of the main ribbon, click Launch Incident Manager, and then using the Launch Incident Manager dialog box, navigate to the desired list, and then click Launch.
The dialog box appears.
- Select the desired tab based on the following views:
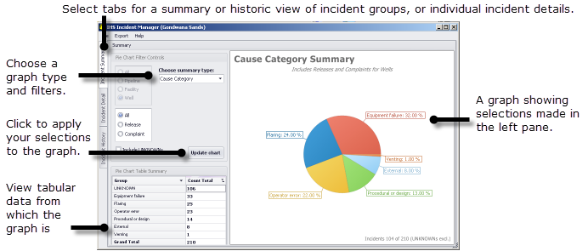
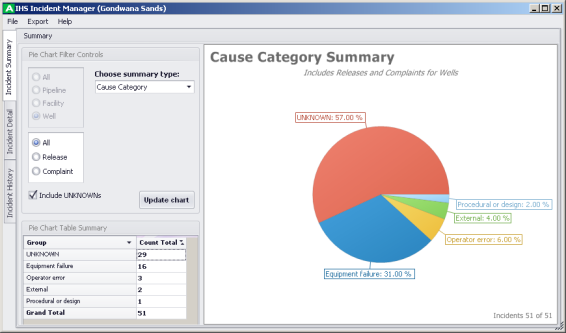
- Incident Summary - view summarized distribution of incidents in a pie chart for several pre-defined categories. Filter by item (facility, pipeline, well), and release vs. complaint. Report on different criteria by selecting a different summary type in the drop-down list.
- Incident Detail - view header, license, and incident details for a single incident selected in the table at the bottom of the dialog box. Rows in the table can be sorted and filtered.
- Incident History - view summary information in a bar chart for several pre-defined categories with number of incidents along the Y axis, and year along the X axis. Filter by item (facility, pipeline, well), and release vs. complaint.
- Functionality varies depending on the tab selected. The following graph functionality is similar between the two graph tabs:
Choose the summary data to graph using the Choose Summary Type drop-down list.
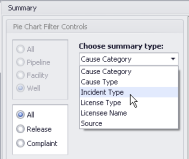
Select whether to show only facilities, pipelines, or wells in summary graph, and either releases or complaints, and then click the Update Chart button each time the above criteria are changed.
- The following functionality is unique to each different tab:
- Incident Summary - include Unknowns (events for which the type hasn't been reported or confirmed).
- Incident Detail - details for every individual incident. Right-click a column header to sort, , or columns. The right-click context menu also enables you to create and specific alphanumeric characters in the table.
- Depending on the tab, summarized, historic, or individual incident details can be printed or saved as a file in Microsoft Excel or CSV format. To output graph or incident data, from the Export menu, click the tab name, and then click either Chart Report, or Data Grid.
 Related Topics