Viewing Multi-Well Analyses
With multiple wells selected in the Data Navigator pane of the DataCard, click Multi-Well Analysis to display the production data for each stream from the separate wells as separate streams on a single graph.
Select the production stream from the drop-down list in the top of the Multi-Well Analysis pane. Graph presentation can be formatted using the Options pane to the right of the graph. Using this pane, tailor both graph format as well as the actual wells behind the graph. The graph can be exported and printed.
To view multi-well analyses
- With a DataCard for the desired item displayed, select the wells for which to review summarized data using the Data Navigator pane in the DataCard, and then click Multi-Well Analysis (
 ).
).
The pane appears.
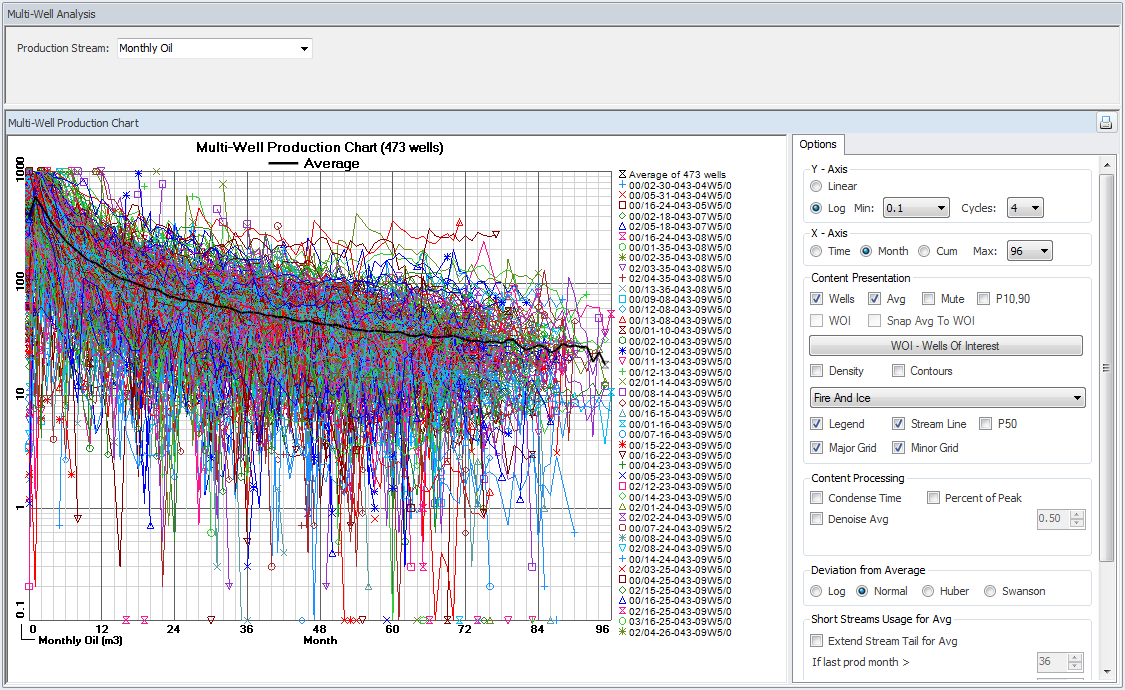
- Select the desired reporting stream using the Production Stream drop-down list that appears above the graph. Features available in the Options pane vary depending on the Production Stream selected, and which of the various options in the Options pane are selected.
AccuMap displays a message when the selected well(s) does not have data for the selected production stream.
- Manipulate the graph display using the Options pane as follows:
- Using the Options: Axis panes, set the Y axis to Log and the X axis to Month so that all of the wells share a common starting point.
- Using the Content Presentation pane, click WOI - Wells of Interest and select one or more wells to compare against the overall group of wells. The streams from these wells can be colored gray by selecting the Mute check box.
- Enable the Avg, P10,90, P50, Snap Avg to WOI, and WOI check boxes.
The P values are defined as follows:
P10 - the value where 10 percent of the outcomes (or values) are greater than this value. There should be at least a 10% probability that the quantities actually recovered will equal or exceed the high estimate.
P50 - the median of a distribution, such that 50 percent of the outcomes are greater than this value, and 50 percent are less than this value. There should be at least a 50% probability that the quantities actually recovered will equal or exceed the best estimate.
P90 - the value where 90 percent of the outcomes are greater than this value. There should be at least a 90% probability that the quantities actually recovered will equal or exceed the low estimate. For example P90 oil recovery is the recovery that is exceeded in 90% of the cases.
The P10, P50, and P90 projections are estimated using the quantile regression method. The deviation from average (Swanson ): Swanson method averages petroleum decline curves using the following formula (0.3 x P10)+(0.4 x P50)+(0.3 x P90).
- Ensure the All Wells, Density Map, and Contours check boxes are cleared.
- Using the Content Processing pane, select Condense Time, ensure Percent of Peakis cleared, and select Denoise Average.
- Using the Short Streams Usage for Avgpane, select Extend Stream Tail for Avg, and tweak the values using the If Last Production Month > and ...value <, and the Extension Factor controls.
- Toggle the wells selected for averaging that appear in the Data Navigator pane to change the calculated average.
- Click a line on the graph for either a well or the average, and then move the cursor along the line to display a tooltip that shows the X and Y axes values and the UWI (or "Average").
- Using the Export Data pane, either select the production stream of a well to export and then click Selected Well, or click All Wells and Avg.
- Right-click the graph and from the context menu, click Copy as EMF+ or Copy as Bitmap in order to paste an image into another application.
 Related Topics