Viewing Wellbores in 3D
Launch Wellbore 3D Viewer in either of the following modes:
- Single well mode - where the center point of your well data is based on a specific well. With single well mode, you can expand the encompassed area and surrounding wells to include well data in the surrounding area within a 2,000 meter radius of the top and bottom hole of the subject well.
- Cross section mode - where only the wells in a cross section you create using the Cross Section tab are included. Some of the functionality available in single well mode is not included in cross section mode as it is not relevant to that mode.
The Wellbore 3D Viewer displays the subject well, neighboring wells or cross section wells (depending on how you launched it), formation tops, completions, and the structural surface, which is generated on-the-fly. Wellbore 3D Viewer enables you to see how a well relates to neighboring wells or cross section wells, and to a given structural surface. This is especially important for directional drilling, where wells have multiple legs in close proximity, and also to get a good understanding about the structural geology in area.
Wellbore 3D Viewer supports most properties of annotations created using Profile Viewer with the exception of balloon border and offset. It also shows annotations from adjacent wells. User completions can only be created and edited using Profile Viewer. To see changes made to wellbore annotations using Profile Viewer in Wellbore 3D Viewer, press Reload Data ( ). Annotations are written to files located in your user directory.
Launch Wellbore 3D viewer for either vertical or deviated wells. For deviated wells, an associated directional survey (either system or proprietary) must exist; otherwise Wellbore 3D viewer won't launch.
To view wellbores in 3D
- Using the DataCard, or the Profile Viewer, select Wellbore 3D Viewer (
 ).
).
The dialog box appears.
- Configure the Wellbore 3D Viewer viewport based on the following guidelines. Some of these options are not available when Wellbore 3D Viewer is launched for a cross section instead of for an individual wellbore:
- Viewport - type or select the start subsea depth at which the viewport begins. Using the Height box, type the depth to include in the viewport down to a minimum value of 25 m to accentuate subsurface trends. The amount you type extends down from the Start Subsea you specified. Visual objects (tops, annotations, etc.) that appear above the Start Subsea depth specified in the Viewport pane are truncated. This removes shallow objects so that you can focus on deeper zones.
Digital logs are truncated at nearly the exact depth specified based on the digitizing increment. Objects in deviated wellbores are truncated using the directional survey stations for precision. Vertical wellbores are truncated using a precision increment of 100 m.
- Well Search Radius - specify the distance around the subject well from which to include wells. AccuMap searches for wells with a top hole or bottom hole that is located within search circles centered on the top hole and bottom hole of the subject well. A larger radius distance displays more wells. To change the subject well, right-dick any portion of the wellbore or any wellbore object (frac, perf, digital log, and so on) and from the context menu, select Set as Subject Well.
Wellbore 3D Viewer does not include intermediate borehole segments between the top hole and bottom hole when searching for adjacent wells because inter well proximity scanning calculations can be extremely time consuming in large congested fields.
- Using the tab, load one or more proprietary logs into AccuMap Wellbore 3D Viewer by either linking to the specific LAS file(s), or linking to a folder that contains the desired LAS files and selecting the desired LAS Mode from the drop-down list.
- Select from the following Render options:
- Tops - whether names of formation tops appear in the main display pane. Subsea depths in user else system format are posted for all tops displayed in the wellbore. You can still select and apply formation tops in the Structural Surfaces pane regardless of whether this option is enabled. Where an unrealistic depth appears for a given formation, correct that instance of the formation depth using Profile Viewer, or AccuLogs, and then using the Wellbore 3D Viewer window, click Reload Data to update the display.
- Annotations - whether annotations created using Profile Viewer appear in the main display pane. If subsequent changes are made to annotations while the Wellbore 3D Viewer remains open, click to display the latest changes in Wellbore 3D Viewer.
- Land Grid - whether to display DLSS, FPS, and NTS grids for wells in BC, AB, SK, MB, and NWT. A structural surface must be displayed in the Wellbore 3D Viewer in order for the land grid to appear.
- UWI - whether to display the UWI at the top and bottom hole locations in the display pane.
- Wells without DS - whether to display wells without directional surveys in the display pane, rendering an imitation survey based on three survey stations as follows:
First Station - corresponds to the top hole locations (Top Hole Longitude, Top Hole Latitude, TVD = 0).
Second Station - imitates the landing point (Top Hole Longitude, Top Hole Latitude, TVD = TTVD).
Third Station - corresponds to the bottom hole location (Bottom Hole Longitude, Bottom Hole Latitude, TVD = TTVD).
Wellbore 3D Viewer then resamples the initial survey with a 100 meter increment before sending it to the 3D rendering engine. Below is an example of a simplified borehole presentation. From the top it looks like a straight line, but the side view shows a sharp, curved horizontal well.
If the TTVD is not available for a concrete well, Wellbore 3D Viewer grabs the surrounding subsea depths for tops with the same name as the Formation at TD for this concrete well (using a 1000 meter spatial search radius from the bottom hole), then based on the inverse-to-distance method, it calculates a gridded bottom hole subsea, shifts it down to 10 meters (assuming the landing point is below the targeted formation top), and finally using the well elevation, it obtains the TTVD. If Wellbore 3D Viewer can’t get the TTVD from the surrounding tops, it estimates the TTVD using the "travel distance" rule: TTVD = TD - VSECmax.
Where: TD – Total Depth (actual or projected total drilled measured depth); VSECmax – max Vertical Section (or spatial distance between top hole and bottom hole). In this case due to the unknown wellbore curvature, the horizontal leg can be positioned significantly deeper than the actual well path.
Although clearing this option hides 3D borehole trajectories for wells without directional surveys, wells without directional surveys are always rendered on the structural canvas during the FPZ and Inter-Wellbore Communication workflow because the risk analysis requires that all wells with any status be displayed .
- MS Frac Range - whether merged system completion frac records that correspond to a multi-stage frac range appear.
- Using the Digital Logs group, select the coloring and cut off settings for the log, and surrounding logs (Other Wells), and whether a measured depth grid appears. When MD Grid is selected, the log scale --including the left and right scale, and curve mnemonic appear at the bottom hole location. If Other Well is selected, it appears at the bottom of all wells.
The gamma ray logs for relevant wells are only downloaded from S&P Global Inc. the first time they are displayed for a well. The log file is written to the \DigiGeoData\Wells\UWI\log folder that appears in your AccuMap data directory. The file is in compressed crv format and loaded from there in future sessions. Select Normalize GR to normalize the curve using overlying and underlying shales. To reduce clipping, select large value from the Max GR drop-down list.
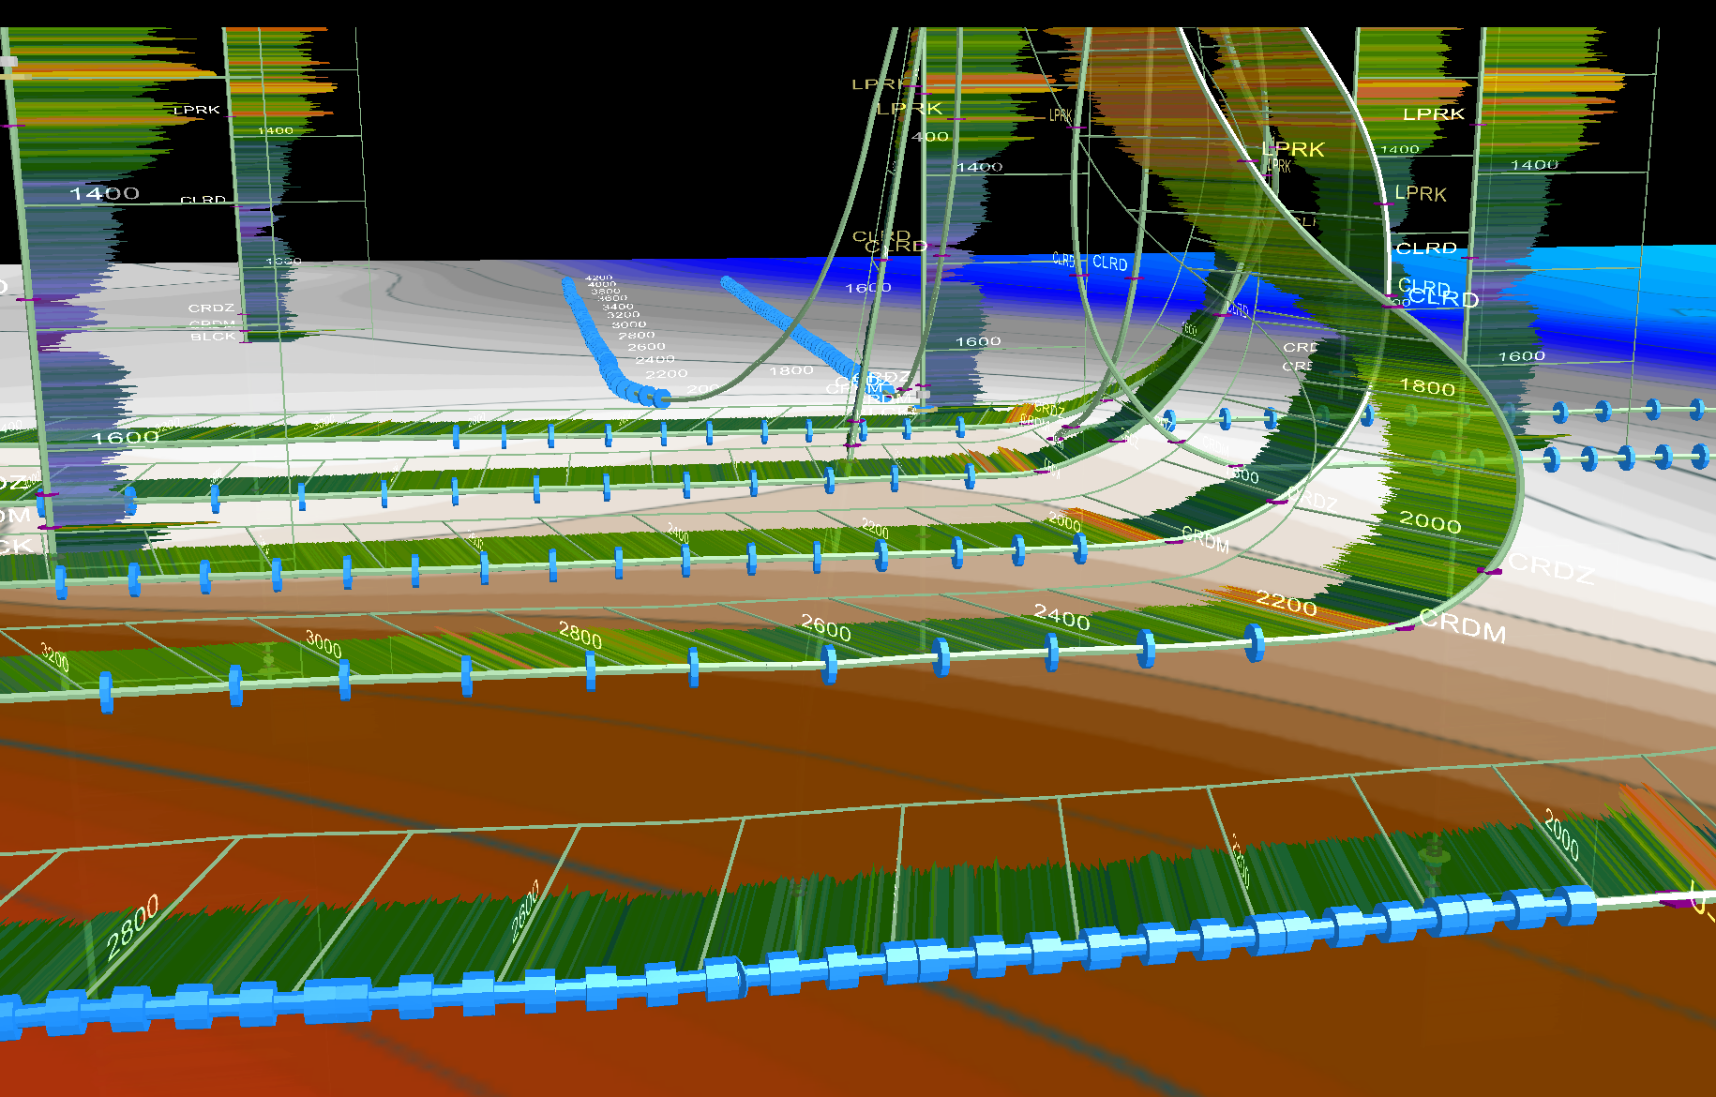
Fences are used in high-density areas to correlate tops for wells running from west to east (Inline) or from south to north (Crossline) in a swath that is plus or minus 300 meters on either side of the line of traverse. Wellbores not found within this 300 meter swath or that don't have a digitized gamma ray log are removed from the main display pane. Following is a rotated view in Wellbore 3D Viewer to illuminate the correlation fence concept:
- Set the structural surface based on the following guidelines:
- Structural Surfaces - the list of relevant tops is constructed using neighboring tops that fall within + or - 4,000 meters of the spatial center. Using the drop-down list, select the formation(s) to display and to compare against the subject wellbore. For horizontal wells, a proximity envelope is shaded to indicate the degree to which the horizontal well varies from true vertical depth and the amount by which it either falls short of or exceeds the depth of the formation selected. To shade individual proximity envelopes for every horizontal well in the viewport, click the Other Horizontal Wells check box.
Select <Surface> from the above options to show the stratigraphic surface.
- Contours - display min / max contour lines that are based on the elevation of the structural surfaces.
- Transparency Slider - drag the slider to control the opacity of the formation selected in the formation drop-down list to the left. The right-most position is no opacity. The left-most position is maximum opacity.
- Data Points - enable to display the data points upon which the rendering of a structural surface are based.
- Click Save Settings as Preferences to save the above settings as the default display settings with which to render both the current well and future wells that have not been displayed before in the 3D Wellbore Viewer. Any alterations to the latest display are saved for that particular well and used the next time it is displayed in 3D Wellbore Viewer. These settings only override the last saved default preferences when you click Save Settings as Preferences.
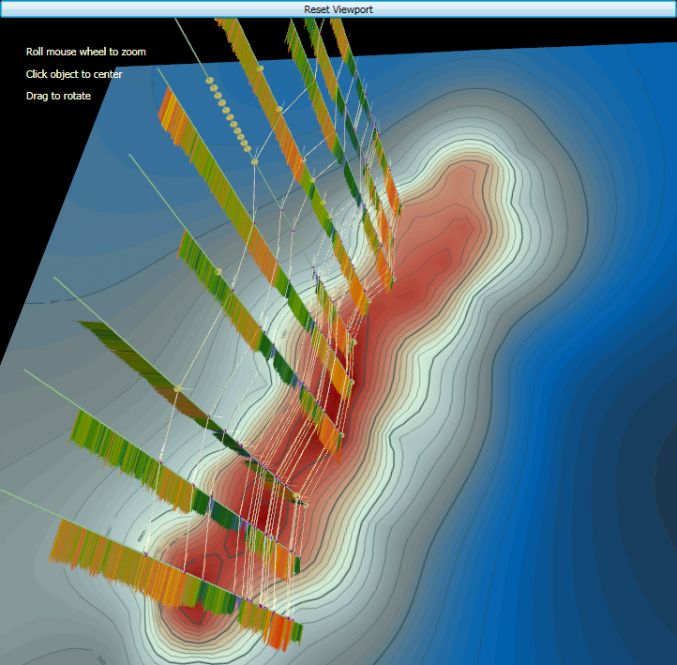
- Roll the mouse wheel to zoom in to an object or a portion of the layer cake that's of interest. Click that point to define it as the center of rotation, and then click and drag your mouse to rotate the wellbore in any direction.
A high-degree of rotation control is possible by zooming in significantly and then clicking a new point to define a more precise rotation center point each time that you adjust the wellbore angle of rotation.
- Hover the cursor over attributes in the wellbore, such as the gamma ray curve, a casing pipeline segment, a Frac object or Frac graph, a perf treatment, or a formation top in order to display details in a tooltip window.
- Click the Legend tab in the bottom-right of the Wellbore 3D Viewer dialog box to display a color chart correlated to completion types and to fluids.
- Output the display pane by clicking either Print Preview or Copy... in the Main ribbon.
Not all printers support transparent mode and for those that do, processing can be extremely time-consuming. Because of this limitation, Wellbore 3D Viewer converts the semi-transparent structural surface to opaque during Print Preview mode. To preserve semi-transparent mode, click Copy as Bitmap ( ) in the Main ribbon of the Wellbore 3D Viewer and then paste the image into a third-party application such as Microsoft Office and print it using that product.
 Related Topics