Creating a Pie Chart Bubble Map
Pie chart bubble maps plot fluid volumes as a fraction of the total original fluid in place. There are three pie map types to choose from:
1. Cumulative Liquid (Np:Wp) — plots produced oil and water as a fraction of the total fluid (oil + water) produced.
2. OGIP (Gp:RRg:OGIP-EURg) — plots produced gas, remaining recoverable, and unrecoverable gas as a fraction of the total gas in place.
3. OOIP (Np:RRo:OOIP-EURo) — plots produced oil, remaining recoverable, and unrecoverable oil as a fraction of the total oil in place.
To create a pie chart bubble map:
1. Click the GIS tab.
2. Click
the Layers button; click the Add Layer (![]() )
icon; then select Add Bubble Map Layer.
The Create Bubble Map: Select Name and Type dialog box opens.
)
icon; then select Add Bubble Map Layer.
The Create Bubble Map: Select Name and Type dialog box opens.
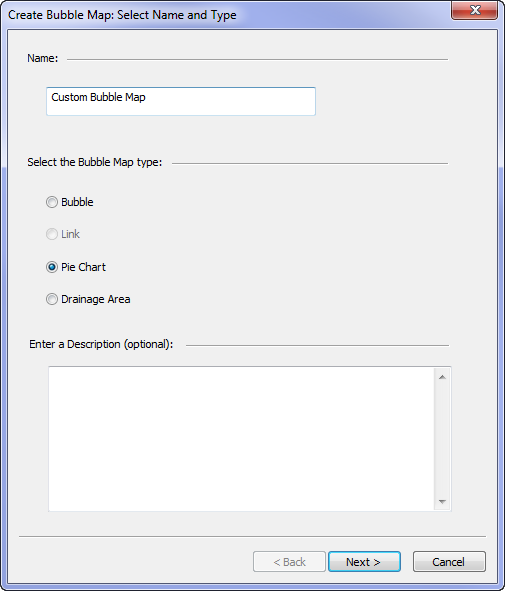
3. Enter a name and (optionally) a description; select the Pie Chart type; then click Next >. The Create Bubble Map: Select Entities dialog box opens.
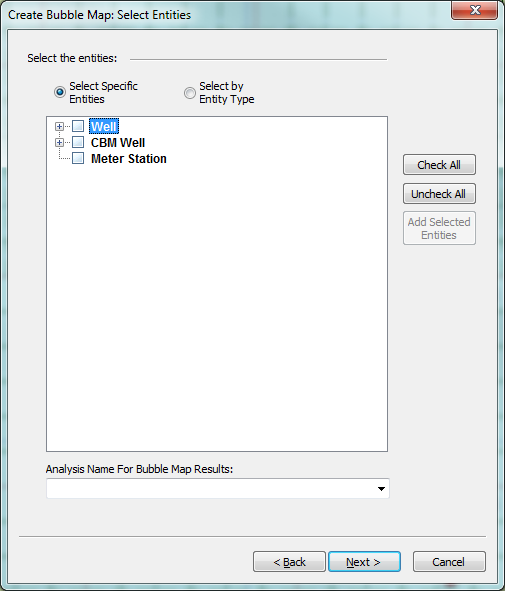
4. Select the entities to be included in the bubble map, and select which analysis the bubble map should pull parameters from by clicking the Analysis Name For Bubble Map Results drop-down arrow; then click Next >. The Create Pie Map: Preferences dialog box opens.
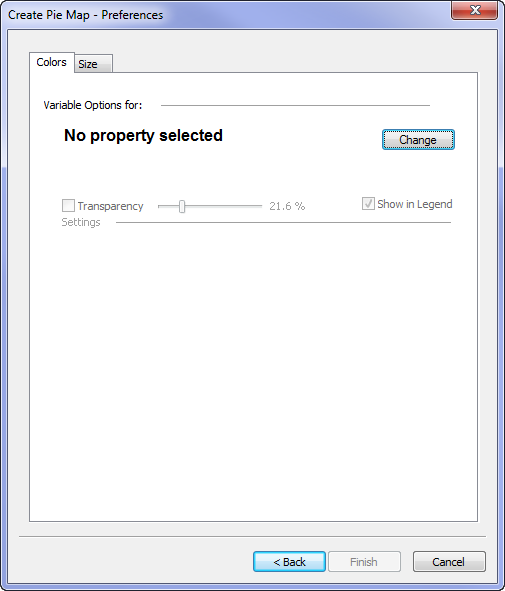
5. Click the Change button. The Pie Colors Attribute: Select a Property dialog box opens.
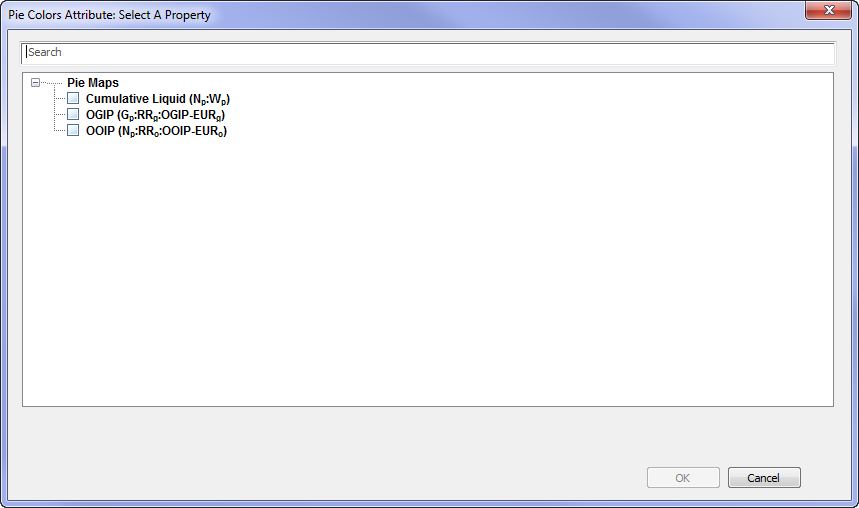
6. Select a map type; then click OK.

Optionally, you can set your preferences for the pie chart:
- Transparency — select this option; then use the slider to set the level of transparency.
Note: Setting the transparency to 100% removes the bubbles from view.
- Show in Legend — select this option to display the tabbed preference in the GIS map legend.
- Reset Ranges... — resets the ranges to either the last-saved ranges, or the default ranges.
Optionally, you can also click the Size tab to set your size preferences for the bubble icons.
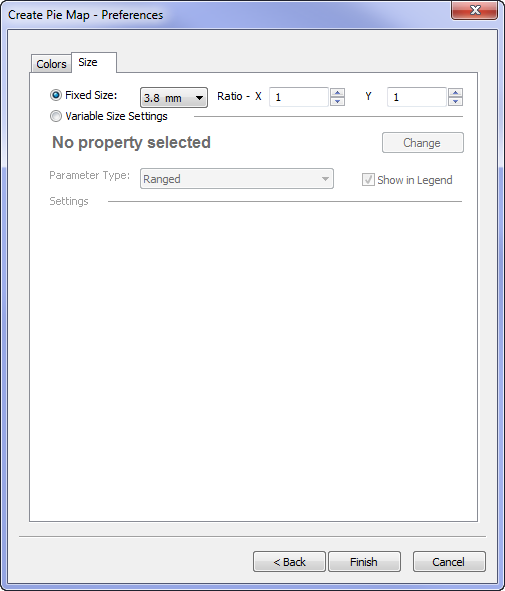
Options include the following:
- Fixed Size — select a bubble size from the drop-down menu.
- Ratio — set an X (width) and a Y (height) value. (The fixed size is multiplied by these values to determine the final bubble size.)
- Variable Size Settings — you can draw variable pie chart sizes according to one of the properties in the Attributes list.
Note: Setting either value to 0 will prevent the bubbles from being displayed.
To use variable size settings, click Variable Size Settings; then click the Change button. Select an attribute; then click OK. You can set the following options:
- Auto Range — calculates a range based on the data for the entities used in the pie chart bubble map.
- Reset Ranges... — resets the ranges to either the last-saved ranges, or the default ranges.
7. Click Finish. The selected entities are displayed as pie chart bubble maps on the GIS tab.