Working with the Forecast Table
To display a forecast on the forecast worksheet, select the analysis box. To display multiple forecasts on a single worksheet, select all of the forecasts you want to display. This populates the raw data of the forecast (rate, period volume, and cumulative production) and the associated time track on the worksheet. If you deselect an analysis, the associated forecast is removed from the display on the worksheet.

The time track defaults to monthly. To change the time period, click the D (day), M (month), or Y (year) icons on the toolbar.
![]()
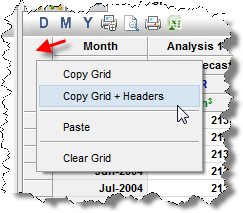
Copy the forecast table by right-clicking inside the blank top left corner of the table, then selecting Copy Grid or Copy Grid + Headers.
Note: You can export the forecast table in .csv format.