Sensitivity Results
The pane to the right of the sensitivity worksheet displays the results of the sensitivity analysis. These results can be displayed by a tornado plot or spider plot; outputs of the sensitivity analysis include:
- Ultimate Recoverable Fluid
- Original Fluid-in-Place
- Average Error
- Ack1/2 (only for Horizontal Multifrac models)
- Drainage Area
- Area of Stimulated Reservoir Volume (only for Horizontal Multifrac models)
- Original Fluid-in-Place in Stimulated Region (only for Horizontal Multifrac models)
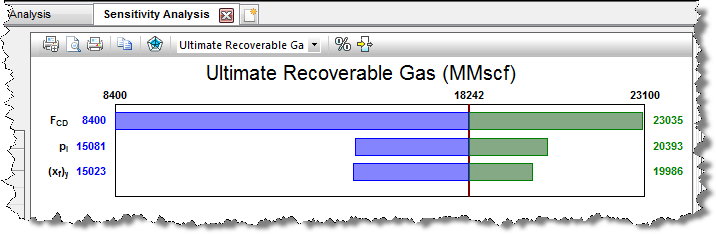
From the drop-down menu, you can specify which output is displayed. The spider plot includes an option labeled All Results, which displays both outputs. Note that the spider plot is missing two of the options from the toolbar; this is due to the fact that the spider plot does not display any values.
- Normalize
(
 ) — converts the outputs from their
actual values to a percent difference from the baseline.
) — converts the outputs from their
actual values to a percent difference from the baseline. - Show Input
Values (
 ) —
toggles the values between the output values (results) and the input
values.
) —
toggles the values between the output values (results) and the input
values.