Specifying the Plot Type
A plot of each parameter’s distribution is displayed just above the parameters. This plot has the probability density on the y axis, and the specified parameter on the x axis.
To specify a parameter, click any field in that parameter's row. To the left of the plot, you can select three different plot types.
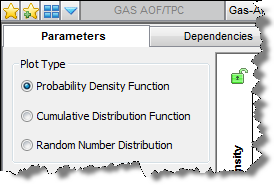
1. Probability Density Function (PDF) — the probability of a random value of x taking certain values.
2. Cumulative Distribution Function (CDF) — the probability that a random variable is not larger than a given value.
3. Random Number Distribution — the distribution of a randomly generated set of values; the number of runs determines how many data points are used.
The shaded areas represent values that will not be considered when the simulation chooses random variables. These areas can be defined by clicking the blue vertical lines, and dragging them left and right.
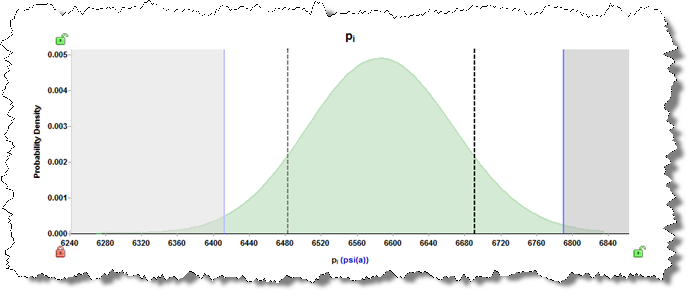
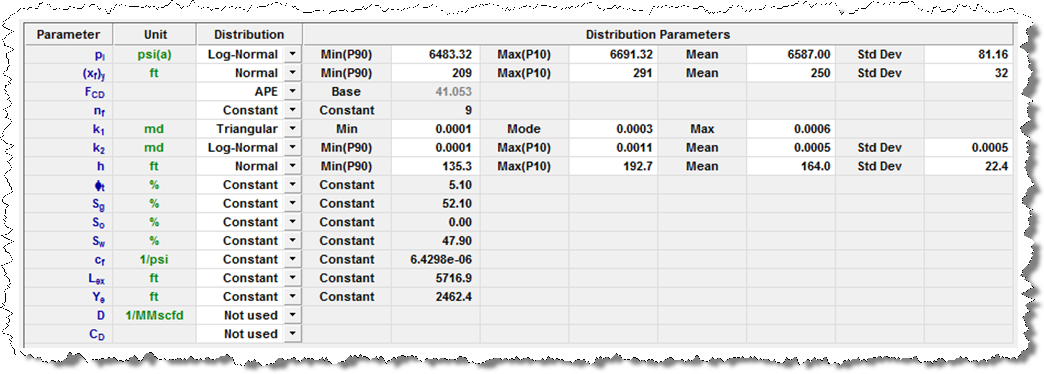
The black dashed vertical lines represent the P90 and P10 values specified in the input grid. You can enter min (P90) and max (P10) values, and the grid will automatically calculate the mean and standard deviation. Similarly, if you enter a mean and standard deviation, the min and max will be automatically calculated and the plot will be updated. Below is a screenshot of the probabilistic input grid.
Flowing Pressure
The flowing pressure (Pwf) is used to generate the forecast from the associated model, and is included as a probabilistic input.
- If the forecast uses the Step method, Pwf represents the initial sandface pressure.
- If the forecast uses the Ramp method, Pwf represents the final sandface pressure.
- If the forecast table consists of multiple rows, only the first row is represented by Pwf. Any subsequent rows will be set to "constant" during simulation.