Specifying Upper and Lower Limits
The table displayed below contains the parameters that will be used to generate a sensitivity analysis. The values listed under the Base column are the baseline values, which are the values used in the associated model. By default, the lower and upper limits are both set to the baseline value. The Reset Values button at the top of the pane resets all the parameters to their defaults.
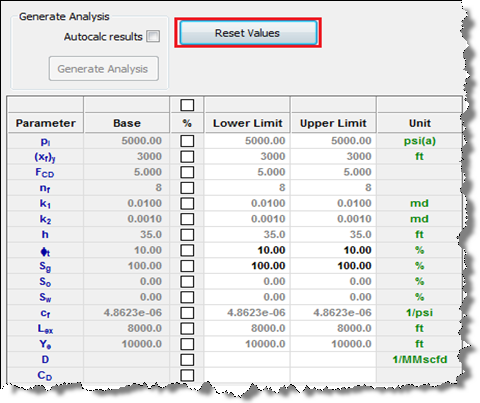
The Generate Analysis button is grayed-out whenever the lower and upper limits are equal to the base values for all parameters. To generate a sensitivity analysis, at least one parameter must have an upper or lower limit that is not equal to the baseline. You can manually enter a limit by selecting a field and entering a value, or by clicking the checkbox under “%” and entering a percentage deviation from the base. A percentage (x) results in a lower limit that is equal to the base multiplied by (1-x), or an upper limit that is equal to the base multiplied by (1+x). You can click the box and enter a percentage, then deselect the box to see what value that percentage yielded. If the checkbox above the “%” label is selected, all of the checkboxes are selected.

Logically, the lower limit must be less than or equal to the baseline, and the upper limit must be greater than or equal to the baseline. If a decimal or a percentage resulting in a decimal is entered, the number of fractures must be an integer, and the value is rounded off to the nearest integer. Once limits have been specified, the Generate Analysis button becomes available. Clicking this icon generates a sensitivity analysis. If the Autocalc Results box is selected, an updated sensitivity analysis is generated whenever a lower or upper limit is modified.