Relative Permeability Correlations
Two-Phase Correlations
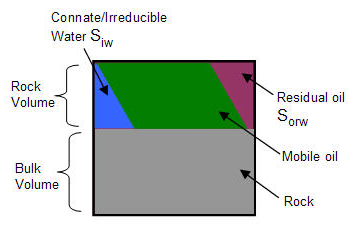
In a two-phase system, the fluids consist of oil and water, oil and gas, or gas and water. An example of an oil-water system is shown below:
Corey
This model assumes the wetting and non-wetting phase-relative permeabilities to be independent of the saturations of the other phases and requires only a single suite of gas / oil-relative permeability data.
Water / Oil System


Gas / Oil System


Gas / Water System


Honarpour
Developed using data from oil & gas fields in the continental US, Alaska, Canada, Libya, Iran, Argentina and the United Arab Republic.
Sandstone
Water Wet

Intermediate Wet

Any Wettability


Limestone
Water Wet

Intermediate Wet

Any Wettability
|
|
|
|


|


Generalized Corey
Similar to the Corey correlation, but developed for a wider range of rock and wettability characteristics. This correlation can be used to change the endpoints of water-oil and gas-liquid relative permeability curves while still retaining the shape of the curves.
Gas / Oil System


Gas / Water System


Water / Oil System


Three-Phase Correlations
Three-phase relative permeability can be generated from the two-phase relative permeability curves of the oil-water system and the relative permeability curves of the gas-oil system. The two-phase curves represent the end curves when either the gas saturation or water saturation equals zero.
Stone I
This probability model estimates three-phase permeability data from laboratory measured two-phase data. It uses the channel flow theory in porous media to obtain a simple result for determining the relative permeability to oil in the presence of water and gas flow. The model implies that water-relative permeability and water-oil capillary pressure in three-phase systems are functions of water saturation alone, irrespective of the relative saturations of oil and gas. Similarly, the gas-phase relative permeability and gas-oil capillary pressure are the same functions for gas saturation in the three-phase system as in the two-phase gas-oil system.
Stone I is widely used in the industry as the benchmark for oil simulation. It is a better predictor than Stone 2 in low oil saturation regions, is more appropriate for water-wet systems, and is not suited for intermediate wet systems.


Stone II
Stone's Model II is a modified version of Stone I. It is a better predictor than Stone 1 in high-oil saturation regions. It is more appropriate for water-wet systems and is not suited for intermediate wet systems.

Baker
Baker's three-phase model is based on saturation-weighted interpolation between the two-phase relative permeability values. It is well suited for intermediate wet or oil-wet systems.
