Integral Anchor
Rate and Pressure Integration are useful methodologies for smoothing production data, which always has some inherent noise. A derivative typecurve plot (that uses the "pressure integral" or "rate integral" as the base data set instead of the actual flowing pressures and rates) tends to be a great deal smoother than the "raw data" derivative. Nevertheless, data integration introduces a new problem that is not seen with conventional derivative plots - namely cumulative errors.
Initial Integral Point – Approximation
For the rate integral (Blasingame Typecurve Plot), the definition is as follows:
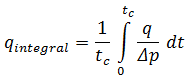
The accepted method of calculating the first rate integral point is to assume that the normalized rate is constant over the first time period. Thus, the first point is equal to the first normalized rate.
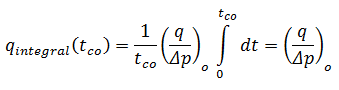
This approximation is acceptable, provided the time period is relatively small.
The cumulative error in the rate integral (and consequent error in the derivative) can be significant if:
- Data is averaged over large time periods, and/or
- Early-time data is missing or of poor quality (e.g., flowing pressures not measured during the first year of production)
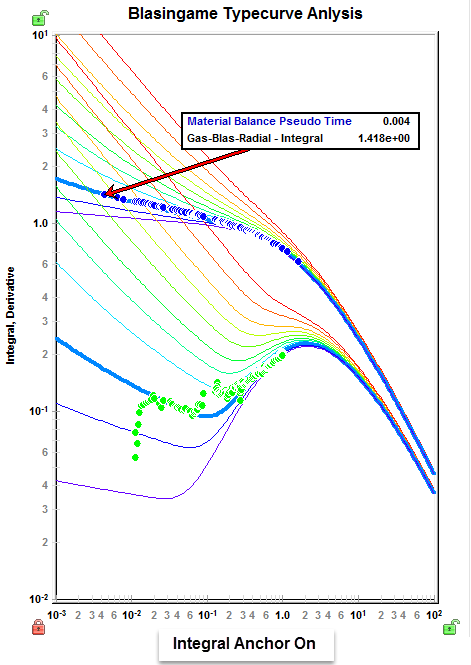
Initial Integral Point – Integral Anchor
The Integral Anchor corrects these errors by evaluating the true initial rate integral point:
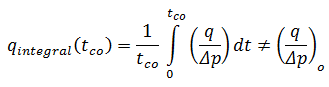
The above can only be solved by assuming a model and evaluating the integral using the theoretical variation in normalized rate with time. In the case of the Blasingame typecurve match, the chosen typecurve is the assumed model, and the initial rate integral point (integral anchor) is evaluated using that model. Thus, a typecurve model must be selected before the Integral Anchor can be applied.
The same logic can be applied to the pressure integral (which is used in the Agarwal-Gardner Rate vs. Time, Normalized Pressure Integral, and Transient typecurves)