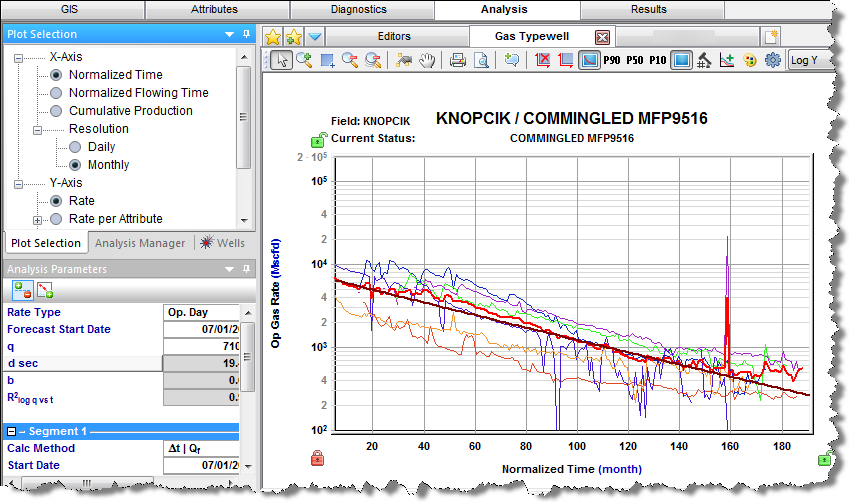
The typewell worksheet is used to view well-level production on a group of wells and calculate average performance. This can be used to create a forecast for wells with limited or no historical production based on a relevant group.
Note: This worksheet works with your IHS Harmony Forecast™ license.
You can add the following typewell worksheet types:
Note: Only the traditional decline analysis is available for each of the above fluid types.
You can toggle different rates by clicking these icons on the toolbar above the plot:
 Show / Hide Average rate — by default, the average rate is shown. Click this icon to show / hide the average rate on the plot. The arithmetic average of all selected wells is determined in each period.
 Show / Hide Wells — by default, all wells are shown.
  P90 / P50 / P10 rates — by default, all these rates are hidden. Click the P90, P50, or P10 icons to show / hide these various rates on the plot.
 For a description of common icons, see plot toolbars.
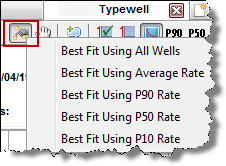
There are several tools that you can use to create a "best fit" using the point-selection method. Selecting any of these options opens the Set Axis Ranges dialog box where you can define the portion of data to be used for the best fit.
The Plot Selection tab lists the options for your plot.
X-axis:
Y-axis:
Use the Wells tab to synchronize well settings between typewell worksheets via the toolbar. In addition, you can change the start period of a well by entering a value in the Start Date Offset boxes, or by clicking the blue left- or right-facing arrows next to the boxes.
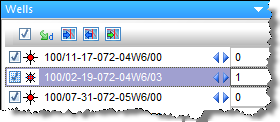
The number in the box corresponds to the time period in which production data starts for the well. (On a time plot, this is either months or days. On a cumulative plot, this is production volume produced in that time period. Therefore, a well with larger production volume moves more than a well with less production volume.)
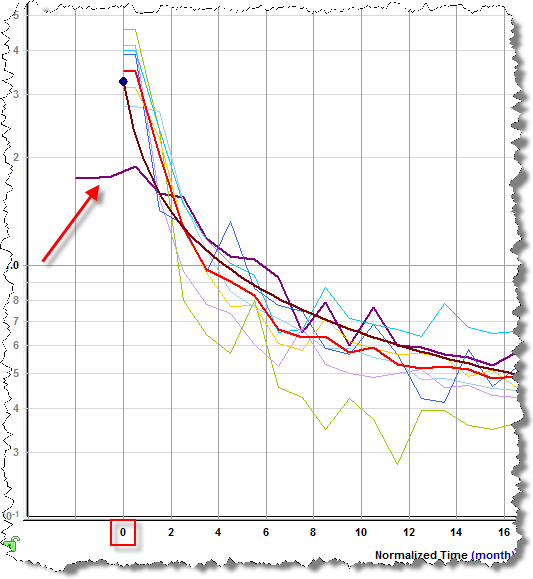
Anything to the left of time zero (0 on the y-axis) is not used for the calculated lines or the decline forecast.
Hovering over a well temporarily displays a thicker line for the associated dataset on the plot.
A selection can be made within the Wells tab, or on the plot. Selections are maintained between the Wells tab and the plot. A selected dataset is displayed with a thicker line to indicate that it is selected.
Wells can be selected in the Wells tab using standard selection behavior (including using the Ctrl and Shift keys). For more information, see selecting entities.
Clicking a dataset clears the existing selection, and then selects the new dataset. Pressing the Ctrl key while selecting a dataset adds / removes the dataset from the existing selection.
This tab has the following icons on its toolbar:
 Check all / uncheck all — selects or deselects all of the wells displayed on the plot
 Set Start Date Offsets to Zero — sets all well offsets to zero.
  Set Start Date Offsets to Peak Rate — sets all well offsets to the well's peak rate – time zero for the well becomes the peak rate instead of the first period.
 Set Start Date Offsets to Specified Value — opens the Shift Spinner Value dialog box where you can set your well offsets (positive values only). This moves the plot to the right (0 corresponds to the beginning of production data. You can also use the blue left- or right-facing arrows on the Wells tab.
Right-clicking wells on this tab lists these options:
The Analysis Manager tab has an Analysis Manager pane and an Analysis Parameters pane. The Analysis Manager only shows typewell analyses, unlike other worksheets, which show all analyses while disabling ones that cannot be displayed on the plot.
Decline and multi-segment decline analyses displayed on the typewell worksheet have their forecast start dates matched to the start date of the first segment, and the forecast always starts at t / Q = 0.
IHS Harmony Enterprise™ 2017.2 | Last revised: July 10, 2017
Copyright © 2017 IHS Markit Ltd. All rights reserved.