Typecurve analysis
With the typecurve worksheet, flowing pressures must be provided at the same frequency as rates in the Production editor (not required for a Fetkovich analysis), and reservoir / fluid parameters must be entered in the Properties editor. If this data is not provided, the typecurve worksheet remains accessible, but the data is not displayed on the plot.
|
Note:
|
This analysis works with your IHS Harmony Reservoir™ license. |
When creating a typecurve worksheet, select your fluid type, model, and then method (for example, Gas, Fracture, Blasingame).
If you analyze a group of wells, you can change which well is displayed by selecting your well from the Primary Well drop-down list. Note that there is no interpretation for these well completion parameters: skin and fracture half length.
Models
Harmony Enterprise supports the following models:
- Vertical — a cylindrical reservoir with a vertical well in the center.
- Radial — a cylindrical reservoir with a vertical well in the center.
- Water Drive — a cylindrical reservoir with a concentrically cylindrical aquifer. This model is based on a radial composite model, with the outer region representing the aquifer, characterized by several different levels of aquifer mobility, relative to the reservoir. The mobility ratios range from zero (no aquifer) to 10 (effectively constant-pressure boundaries). The aquifer model assumes a water zone of infinite extent.
- Vertical with Fracture — a cylindrical or rectangular (Fetkovich) reservoir with an infinite conductivity fracture in the center.
- Finite Conductivity Fracture — a cylindrical reservoir with a finite conductivity fracture in the center.
- Horizontal — a square reservoir with a horizontal well in the center. There are actually nine different horizontal well models. Each model represents a different penetration ratio "Le /2xe"(ratio of effective wellbore length to reservoir length) and dimensionless wellbore radius "rwD" (ratio of effective wellbore radius to effective wellbore length).
- Hz Multifrac — a horizontal reservoir with multiple vertical fractures.
- Compound Linear — an infinite reservoir with a horizontal well and multiple hydraulic fractures (you must specify nf and Le).
Methods
Harmony Enterprise supports the following methods:
Sub-tabs
There are three sub-tabs: plot, forecast, and tables.
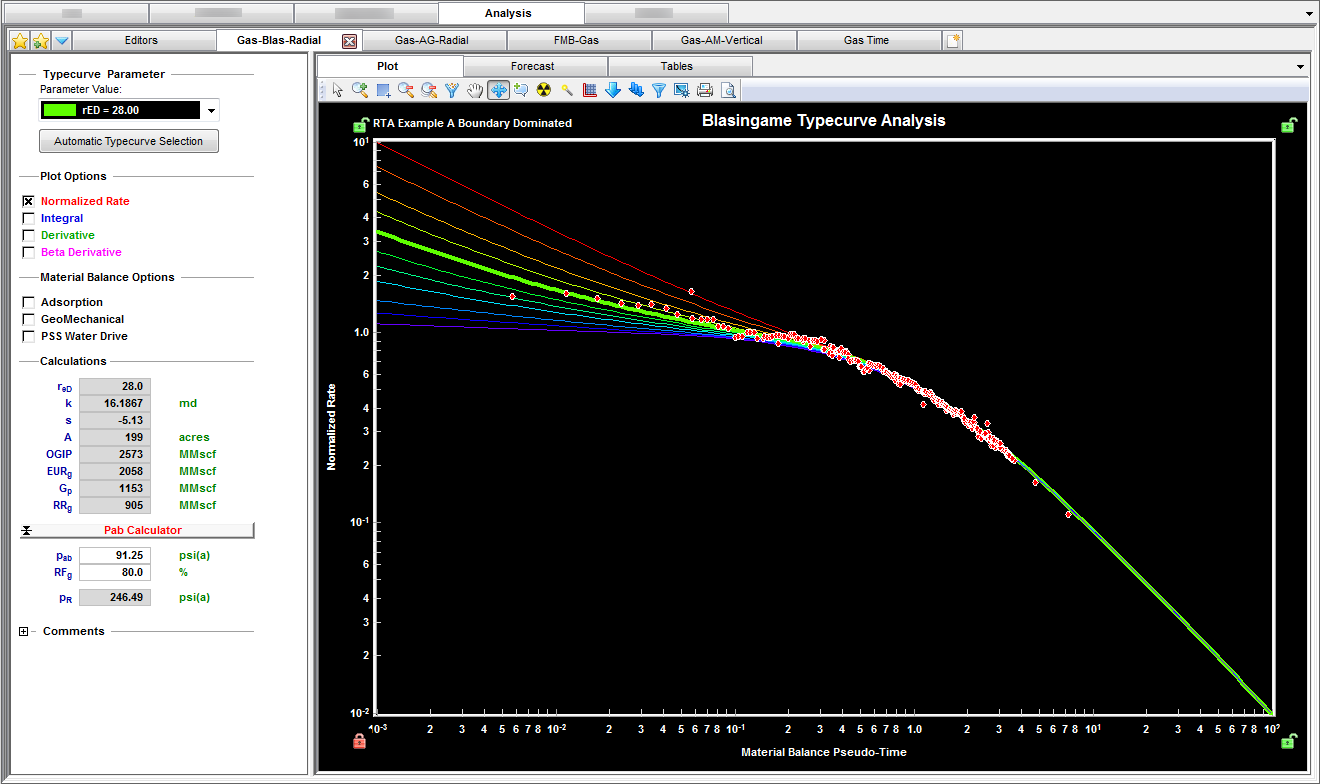
Plot
The Plot sub-tab displays sets of typecurves that can be viewed together or separately depending on which checkboxes you click in the Plot Options section.
1. Normalized Rate
2. Integral
3. Raw Data Derivative
4. Derivative
5. Beta-Derivative (in the Fracture model)
The objective of the typecurve analysis is to move data over top of the family of typecurves (click the Reposition icon) until the data points match one of the typecurves as closely as possible. After you know which typecurve matches your data best, you can select the appropriate parameter from the Parameter Value drop-down list.
We recommend beginning the match with normalized rate data and typecurves. To add further confidence in the match, use the derivative, integral and derivative, or cumulative production (Fetkovich) options to provide a more unique analysis.
|
Note:
|
When one of the typecurve sets is disabled, both the data points and associated typecurves are removed from the plot. |
Toolbar
This toolbar has the following unique icons:
-
 Tools to Select Data Points for Filtering — opens an additional toolbar with point-selection options.
- Tip: Selection of filtered-out (disabled) points is shared between all typecurve, unconventional reservoir, and FMB analyses for the same fluid type. In addition, these selections are saved when you export to a local database, or import from a local database.
-
 Reposition Data on Plot — drag data across the screen.
-
 Reset Plot Attributes — resets your plot attributes to default settings.
-
 Fully Automatic — removes the outliers in your data by applying a median filter.
-
 Enable / Disable Square Log-Log Plot — when enabled, the current plot is made proportional for comparison purposes. Clicking the icon again disables this feature.
-
 Single Annotation — adds a single annotation to a specific point on your typecurve.
-
 Multiple Annotations — synchronizes your annotation across your typecurve, FMB, unconventional reservoir, and data filter plots. For example, if you move your annotation on one plot using the keyboard arrow keys, the arrow is synchronized on the other plots.
-
 Data Filter — opens the Data Filter dialog box where you can select points to hide from typecurve matching.
-
 Options — opens the Typecurve Options dialog box where you can set your derivative options, typecurve settings, and rate options.
For information on common plot icons, see plot toolbars.
Forecast
The Forecast sub-tab displays your forecast: results, options, and constraints. You can send your plot to a comparison plot, by right-clicking it and selecting Send Plot to Comparison Plot. For information on other options, see plot options.
The forecast toolbar has the same common icons described in plot toolbars.
Tables
The Tables sub-tab displays your forecast data in a tabular format.
IHS Harmony Enterprise™ 2018.1 | Last revised: March 20, 2018
Copyright © 2018 IHS Markit Ltd. All rights reserved.