The oil cut analysis is an empirical method for trending water and oil production. When an oil cut analysis is added, it is initialized using a best fit. Since time is on the x-axis, an EUR is not determined.
| Note: | This analysis works with your Harmony Forecast™ license. |
Analysis Parameters pane
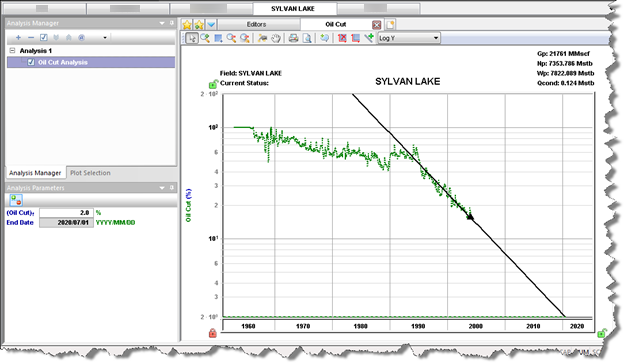
An oil cut analysis can be added / displayed on an open worksheet while time is on the x-axis, and oil cut is on the y-axis. After you add an oil cut analysis (see analyzing an entity), the selected analysis has its detailed parameters displayed in the Analysis Parameters pane.

In this pane, you can specify / view the following parameters:
- (Oil Cut)f — the final / abandonment oil cut. Initialized as 100-WC from the WC value defined in the Options dialog box (under the Water Oil Ratio node). The value must be in the range (0, 100).
- End Date — the corresponding date at the oil cut abandonment value.
Analysis Parameters toolbar
The Analysis Parameters toolbar has the following icon:
![]() Show / Hide Results Line — shows (default setting) or hides the dashed-green line on the plot that represents the abandonment for the oil cut analysis. It is initialized from the settings defined in the Options dialog box, under the Water Oil Ratio node.
Show / Hide Results Line — shows (default setting) or hides the dashed-green line on the plot that represents the abandonment for the oil cut analysis. It is initialized from the settings defined in the Options dialog box, under the Water Oil Ratio node.
Line manipulation
Line manipulations are initiated by clicking-and-dragging:
- Line — changes the slope of the trend line about the manipulation point.
- Manipulation point (
 ) — translates the line vertically or horizontally while maintaining the slope.
Analysis line customization
You can customize your analysis line's width and color by right-clicking and selecting Customize Line.

Your modifications are saved and applied to every worksheet that displays this analysis.