By default, this pane opens in a tab to the right of the Analysis Manager while a worksheet is in focus. For a description of common icons, see toolbars.
To add / remove plot axes:
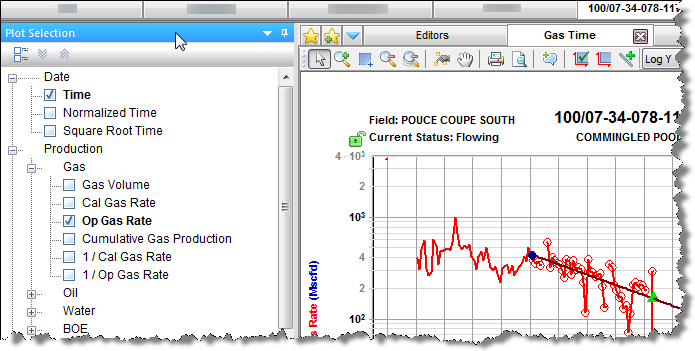
- Checkboxes — Toggling the checkbox for an item within this pane adds / removes the axis from the worksheet.
- Double-click — Double-clicking an item within this pane adds / removes the axis from the worksheet.
- Drag-and-drop — Dragging an item from this pane to the worksheet, adds the axis. The item can be dropped to the position you want: x-axis, y-axis, or over an existing axis to link the axes. If you drop the item to a location that is not over an axis, it is added as a y-axis, unless the item is a cumulative or date series.
To customize datasets / categories:
Whenever you modify a custom dataset or category in the Production editor (add, delete, rename, or update a formula), these changes are reflected in this pane. In order to see renamed items or formula changes from other users, you need to click the Refresh icon on the main toolbar.