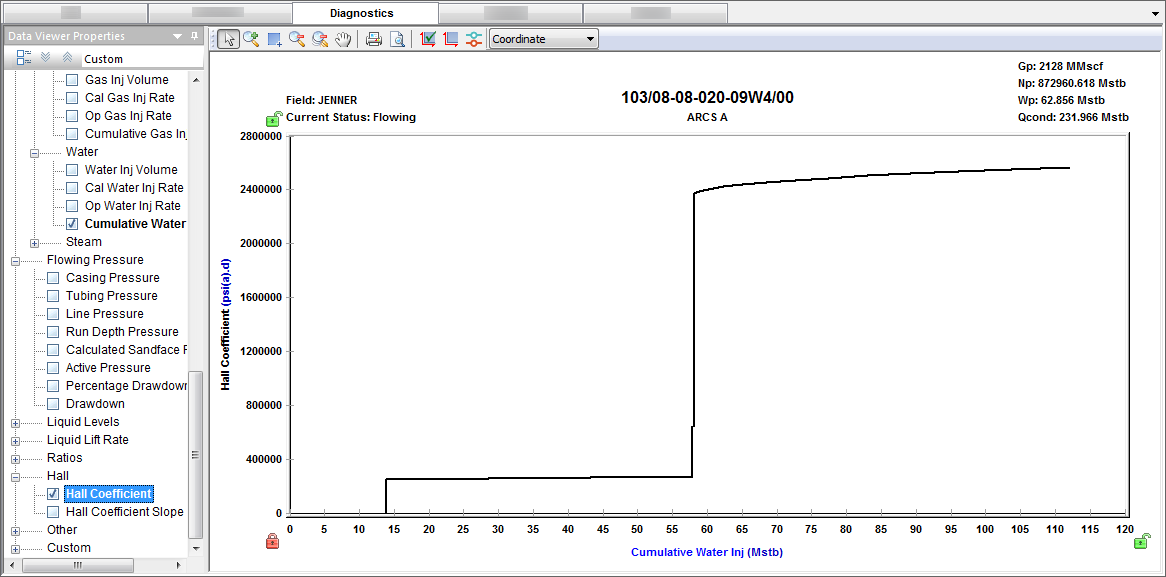
The slope of a Hall plot indicates a well's average injectivity. At normal conditions, this plot is a straight line; deviations indicate changes in injection conditions. For more information, see Hall plot theory.
| Note: | The Hall plot uses tubing pressure, not injection tubing pressure, as an input. |
You can display this plot as follows:
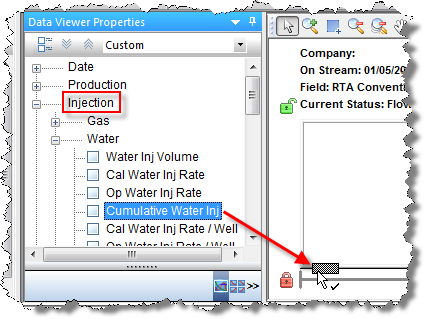
- Click Injection, Water, and drag Cumulative Water Inj to the x-axis.
-
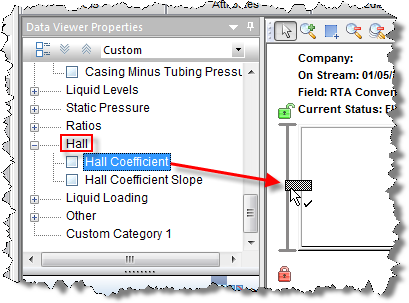
- Click Hall, and drag Hall Coefficient or Hall Coefficient Slope to the y-axis.
-
The Hall plot opens.