This dialog box is commonly used when you add custom datasets or add custom attributes, and you want to use a Calculated type of dataset or attribute.
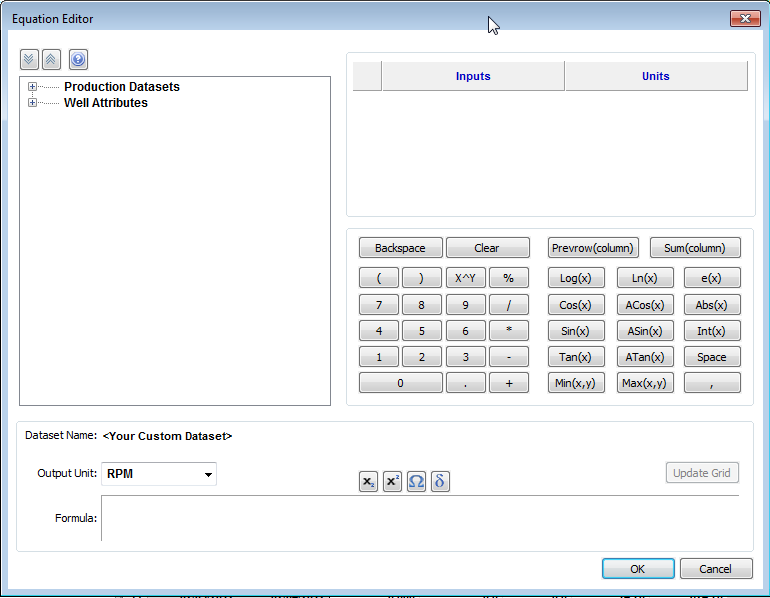
The Equation Editor has the following components:
- Tree structure — displays an updated list of all the production datasets that exist in the Production editor, as well as the numerical attributes that exist in the Attributes tab. This includes custom-calculated datasets, custom-input datasets, custom-input attributes, and custom-calculated attributes. Clicking an item in the tree structure inserts it into the formula.
- Inputs / Units pane — displays the units associated with each input.
- If a dataset or attribute is displayed in an equation twice, only one unit can be associated with that variable.
- The table / grid displays a list of datasets / attributes in the formula pane when you click the Update Grid button, after you enter a valid formula. You can also update the table / grid each time you make a modification to the formula by clicking the Update Grid button.
- Note that if your formula is invalid, clicking OK or Update Grid displays an error message in the lower left corner of the dialog box.
- Calculator — consists of numbers and mathematical functions.
- Formula pane — displays the formula as you create it.
- The output unit is the unit associated with the output of your formula.
- By clicking the four icons directly above the formula area, you can insert subscript, superscript, and symbols within the formula.
- You can use both the on-screen calculator (by clicking the buttons in the dialog box) and your keyboard.
| Tip: | When entering a formula, make sure to add the closing “)” when using a function that opens with a “(“. If your formula is invalid, clicking OK displays an error message in the lower left corner of the dialog box. |
Referencing other datasets / attributes
You can enter a formula into the Formula pane using the keyboard. To reference another dataset or attribute, you must use the following format:
- Attribute: [A:Attribute Name]
- Dataset: [P:Dataset Name]
Dataset-specific functions
There are four special functions: MinCol, MaxCol, Avg, and ValueAt. These functions require production datasets (in columns) as inputs, and normalized time must also be specified.
- The units of normalized time can be selected in the Inputs / Units pane in this dialog box.
- The values "start" and "end" can also be entered as normalized time values. "Start" refers to the beginning of production history, and "end" references the last date of production.
| Note: | Normalized time must be specified as an integer. |
1. MinCol — this function returns the smallest value of the specified column, over a specified period of normalized time.
Equation Format: MinCol(column, start time, end time)
Example: MinCol([P:Gas Volume], end-6, end)
This returns the minimum gas volume during the last six months of production.
2. MaxCol — this function returns the highest value of the specified column, over a specified period of normalized time.
Equation Format: MaxCol(column, start time, end time)
Example: MaxCol([P:Gas Volume], start, end)
This returns the maximum gas volume during the entire production history of the well.
3. Avg — this function returns the weighted average of the specified column, over a specified period of normalized time.
Equation Format: Avg(column, start time, end time)
Example: Avg([P:Gas Volume], 3, 12)
This returns the average gas volume between the 3rd and 12th months of production, based on the following equation:

Although you can specify the period in months, Harmony Enterprise inputs the Δt in days when calculating the weighted average. So, based on the month in the year, Δt can be 28 - 31 days for a full month.
4. ValueAt – this function returns a scalar value from the specified column, at a specified normalized time.
Equation Format: ValueAt(column, time).
Example: ValueAt([P:Gas Volume], 1.5)
This returns the gas volume at 1.5 months. Calculations are done using days, and monthly values are converted using 365.25/12. So, in this case, 1.5 months would be equivalent to 45.6 days. Harmony returns the value at the row that covers the time range which includes this specific time.
| Note: | The start time in Harmony Enterprise is inclusive, and the end time is exclusive. |