Flags are similar to bubble maps, but they do not reflect well attributes. Instead, they are simple markers that can be used to designate individual or multiple entities.
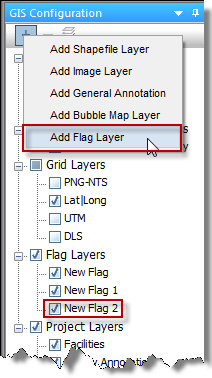
If you add a flag layer (click the + icon on the GIS Configuration pane), a corresponding node in the tree structure is added. You can show or hide flags by selecting or deselecting their checkboxes.
To add wells to an existing flag, select the appropriate wells on the GIS map, and then right-click and select Flags, Add Selection to Flag.
To modify flags, right-click the flag in the tree structure and select Flag Properties. Edit your flag's name, color, size, or transparency.
Flag properties
When you click the Flag Properties button at the bottom of the GIS Configuration pane, you can edit the appearance of flags displayed on top of entities on the GIS map. The drop-down list at the top of the pane determines which flag is being edited.
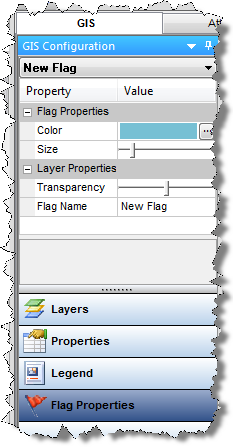
- Color — click the ... button and select the color for the selected flag.
- Size — click the slider to increase or decrease the size of the circle displayed on the map for the selected flag.
- Transparency — click the slider to increase or decrease the transparency of the selected flag. Moving the slider to the left, makes the flag more opaque, and moving the slider to the right, makes the flag more transparent.
- Flag Name — use this field to type a name for the selected flag layer.
Flags are similar in appearance to bubble maps, but they do not reflect well attributes. Instead, they are simple markers that can be used to designate individual or multiple entities.

Flags are represented as layers on the GIS map, and can be selectively enabled or disabled like other layers.