In this tab, you can monitor how your forecasts compare to actual production.
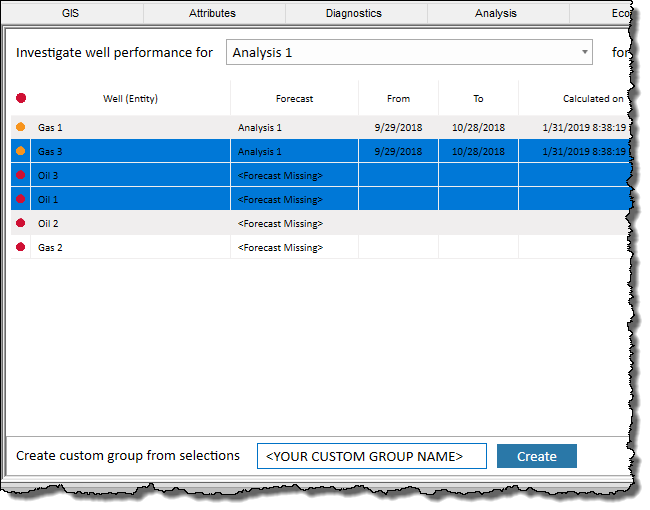
By default, the largest negative cumulative volume is displayed first, sorted by fluid type (that is, gas, oil, water, BOE). Wells are also sorted by status. A red status indicates a forecast has not been found. To fix this, you can select a forecast from the drop-down list, or create a forecast. An amber status indicates incomplete results (for example, missing production data, missing dates, etc.). Note that only the first issue with a fluid is reported (for example, no oil production data). A blank status indicates there are no issues.
Actual production volume can vary substantially. Therefore, assessing the deviation from a forecast is only meaningful over a defined duration window. The period of time you set must be sufficiently long enough to iron-out fluctuations in the empirical data, yet brief enough to alert you of any adverse trends. By default, the last 30 days of production are displayed in a tabular format. If there are more than 20 wells, a status bar is displayed after you click Calculate.
| Note: | You can sort tabular data by clicking the column headers, and columns can be reordered by dragging-and-dropping. Your first five columns are frozen, so you can keep track of key information as you scroll horizontally. |
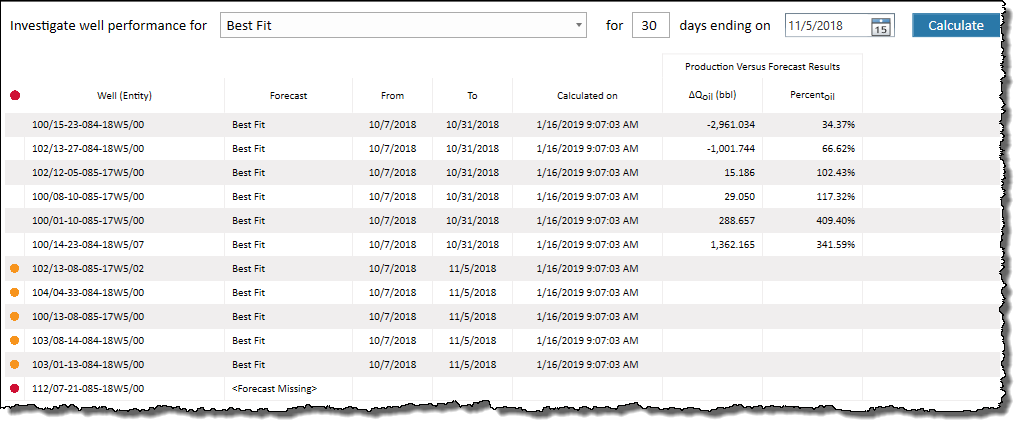
Investigate well performance for drop-down list — select a forecast to compare against actual cumulative production.
for <30> days field — type a number of days between 1 and 365 for calculation purposes (30 days is the default value). Note that typing a larger value may influence calculation time.
![]() Calendar icon — select an end date of calculation. For example, if you select August 31st, calculations are run for a production window between August 2nd to 31st (assuming you kept the default value of 30 days).
Calendar icon — select an end date of calculation. For example, if you select August 31st, calculations are run for a production window between August 2nd to 31st (assuming you kept the default value of 30 days).
Calculate button — click this button to calculate the cumulative volume difference between actual production and the forecast, as well as percent differences. These calculations apply to the selected well's forecast for all fluid types, or group of wells. Calculations are saved to the database.
Volume variance = cumulative production - cumulative forecast production. A positive difference indicates you are producing more than expected.
% volume variance = cumulative production / cumulative forecast production x 100.
If you select an end date that occurs after the last production date, calculations are displayed up to the last date of production, as shown in the To column. For example, if you select an end date of Nov 30th, but your production ends on Nov 20th, calculations are shown up to Nov 20th, and the To column displays Nov 20th.
| Tip: | If you export or import wells with an .hldb file, the data in this tab is not saved, and to have this data, you need to recalculate. |
After you select entities in the Entity Viewer - Hierarchy pane and click the Monitor tab and then click a Well (Entity) in this tab, the Create custom group from selections section opens at the bottom of the pane. Based on your selections, you can create a new custom group. After typing a custom group name and clicking the Create button, a new custom group is created in the Entity Viewer - Custom pane.