Gas AOF / TPC theory
Wellhead C, n deliverability
The "deliverability" of a system is its capacity to deliver gas as a function of pressure. The maximum possible capacity is called the absolute open flow potential (AOF), and reflects what the system could deliver if there were no external losses acting on it; (that is, if the flowing pressure was equal to zero).
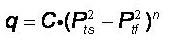
The equation governing the inflow performance relationship is known as the Rawlins-Schellardt back-pressure equation. It is a universal relationship that applies to all gas wells and is independent of reservoir drive. It is generally derived from AOF or inflow performance testing. For wellhead d eliverability, the equation is stated as:
Where:
q = flow rate, MMscfd or 103m3/d
C = constant, MMscfd/(psi2)n or (103m3/d/kPa2)n
n = turbulence of flow, dimensionless
Pts = static
wellhead pressure, psi or kPaa
Ptf = flowing wellhead pressure,
psi or kPaa
Wellhead, C
The “C” value for a well defines the magnitude of the wells rate response to changes in pressure. Larger C values correspond to higher deliverability wells. A wellhead C value is sometimes available from a well-test report.
There are no limits on the range of allowed "C" values due to the complicated interaction between C, AOF, n, and pressure. Be aware however, that the system is very sensitive to changes in "C" and that extreme values of "C" can result in extremely large deliverability potentials, which can cause system instabilities.
Wellhead, n
The ‘n’ value is a measure of the effect of turbulence in the near-wellbore region on the well’s performance. Values for "n" are valid only between 0.5 and 1.0. A default value of 1 corresponds to very laminar flow, so little in the way of near-wellbore turbulent pressure losses. A value approaching 0.5 corresponds to significant losses due to highly turbulent flow in the near-wellbore region.
Values of n closer to 0.5 are most appropriate for wells that are expected to flow at high drawdowns, or for wells with high deliverability potential. Values approaching 1 are most appropriate for aging wells, or for low deliverability wells. Note that while in theory a value of n = 1 should not be possible, standard practice often prescribes an n value of 1 to aging or low deliverability wells that are expected to flow at a low rate.
Sandface C, n deliverability
With Sandface C, n deliverability, you can specify the constants of the back-pressure equation (also known as the Rawlins-Schellhardt equation), the Sandface "C" and the Sandface "n", to define the deliverability of the well at the sandface. The C and n values are generally determined from standard AOF / Back Pressure / Deliverability tests, but they can also be calculated / estimated from current operating conditions, if some assumptions are made.
Sandface C,n deliverability uses the back-pressure equation to define the well's deliverability. The back-pressure equation is an empirically derived industry standard that applies to all gas wells, independent of reservoir drive. It is generally derived from AOF or inflow performance testing. The back-pressure equation is stated as:

Where:
q = flow rate, MMscfd or 103m3/d
C = constant, MMscfd/(psi2)n or (103m3/d/kPa2)n
n = turbulence of flow, dimensionless
PR = reservoir
pressure, psi or kPaa
Pf = bottomhole flowing pressure,
psi or kPaa
Sandface, C
The “C” value defines the magnitude of the well's rate response to changes in pressure. There are no limits on the range of allowed "C" values. Be aware however, the system is very sensitive to changes in "C" and that extreme values of "C" can result in extremely large deliverability potentials, which can cause system instabilities.
Sandface, n
The inverse slope on the back-pressure plot, "n", describes the effect of turbulence in the near-wellbore region. Wells that are operating at high drawdowns, or wells with high permeability, can experience significant energy loss in the near-wellbore region due to the development of turbulent flow from the high gas velocities. The “n” value helps account for this effect.
An "n" value equal to 1 describes completely laminar flow (no turbulence). and an "n" equal to 0.5 describes a very turbulent flow. In practice, values equal to 1 or 0.5 are not seen, but it is fairly common industry practice to use an n of 1 on low-to mid-deliverability gas wells that are not expected to operate at low drawdowns, and thus, where turbulent effects are minimal.
Values of n closer to 0.5 are most appropriate for wells that are expected to flow at high drawdowns, or for wells with high deliverability potential. Values approaching 1 are most appropriate for aging wells, or for low deliverability wells. While in theory a value of n = 1 should not be possible, standard practice often prescribes an n value of 1 to aging or low deliverability wells that are expected to flow at a low rate.
Another common practice for n when it is not known is as follows:
- <1 MMcfd use n = 1.0
- >5 MMcfd use n = 0.5
- 1-5 MMcfd use n = 1.0 - 0.5 (interpolation)
The n value is a function of permeability, or wellbore radius, of skin in the near-wellbore region, and other variables, so making an assumption based purely on well rate needs to be understood in this context. If possible, it is always better to use an n derived from a well test, or even from analogy of similar performing wells from the same geological structure.
The n value cannot be less then 0.5 or greater then 1.0. Input values less than 0.5 are automatically set to 0.5, and values greater than 1.0 are automatically set to 1.0.
Understanding the curves displayed in the Wellbore Tuning plot
The Wellbore Tuning plot displays the deliverability curves for the well, in addition to a few diagnostic curves.

Sandface Deliverability Curve: The Sandface Deliverability curve is the black curve, and it displays the pressure response at sandface as a function of well rate. The curvature is defined as per the C and n values you enter, while the Y-intercept is defined by the current reservoir pressure (when the flow rate equals zero).
Wellhead Deliverability Curve: The Wellhead Deliverability curve is the purple curve. The wellhead deliverability curve displays the pressure response at the wellhead as a function of well rate. The Wellhead Deliverability curve is determined from the sandface deliverability curve and the pressure losses in the wellbore. For any given rate, the wellhead pressure can be defined as the sandface pressure at that rate minus the pressure losses in the wellbore.
Liquid Loading Diagnostic for Casing: The blue and green parabolic-shaped curves are the Liquid Loading diagnostics. There are two diagnostic curves displayed: one green and one blue. The green curve is a diagnostic for the casing. For any given pressure (measured at MPP), the green curve reflects the minimum flow rate required to lift liquids at MPP. For flow rates and pressures to the left of the green curve, liquids cannot be lifted at MPP, while for flow rates and pressures to the right of the green curve, liquids can be lifted at MPP.
Liquid Loading Diagnostic for Tubing or Annulus: The blue curve is the diagnostic for the tubing or annulus. For any given pressure (measured at EOT) the blue curve reflects the minimum flow rate required to lift liquids at EOT and above. For flow rates and pressures to the left of the blue curve, liquids cannot be lifted at EOT and above, while for flow rates and pressures to the right of the blue curve, liquids can be lifted at EOT and above.
There are separate diagnostics for the tubing / annulus segment and the casing segment because the diameter of each segment of the wellbore is different, and thus, the same flow rate through both segments results in different velocities for the gas. Generally the tubing / annular segment is a smaller diameter then the casing segment. A well first reaches a point where liquids cannot be lifted in the casing, followed later by a lower rate to the point where liquids cannot be lifted in the tubing / annulus.
Sandface C calculation
With these calculations, liquid loading can be excluded or included.
Excluding liquid loading
It is assumed that gas can lift liquids throughout the wellbore. The single phase or multi-phase correlation is applied to the length of the wellbore.
A value for Sandface C is calculated based on the current flowing pressure, rate, and LGR that have been entered as the Surface Test condition.

The above figure illustrates how the ability of the well to lift liquids is ignored. Note that to the left of the liquid-loading diagnostic curves for the tubing / annulus and casing (blue and green curves), there has been no change to the wellhead deliverability curve.
Including liquid loading
We can estimate the sandface deliverability of a well that can no longer lift liquids by using the non-flowing pressure. Note that non-flowing pressure can only be used when a well does not have a packer installed downhole.
Theory: using non-flowing side pressures to calculate well deliverability
The application of non-flowing pressure to calculate Sandface C comes about because of the unreliability of using flowing-side pressures for wells that cannot lift liquids in the tubing / annulus. The extent that liquids accumulate in the tubing / annulus is an unknown, and therefore using flowing-side surface pressures to estimate sandface conditions is unreliable. On the other hand, with non-flowing side pressures, a much more reliable sandface pressure estimate can be attained.
The theory behind using non-flowing pressures to calculate Sandface C is based on the distribution of liquids in a wellbore after a well can no longer lift liquids to surface.
Consider the scenario where a well can no longer lift liquids to surface either in the casing or the tubing. Liquids accumulate in the wellbore in both segments of the wellbore (see figure below).

Note how the liquids accumulate on the flowing side of the wellbore (in this case in the tubing), but not on the non-flowing side (annular side).
Because liquids do not accumulate along the non-flowing side, the only pressure drop across that side is due to the presence of the gas. The calculation of the pressure drop from surface to EOT due to the hydrostatic column of gas is a reliable one.
For most wells, the end of tubing is landed within a short distance of MPP. Thus, the pressure drop in the casing segment due to the liquids that have built up is generally small in relation to the reservoir pressure, and therefore an approximation of this pressure drop is usually sufficient. By default. we assume that the pressure loss in the casing due to liquids is equal to the length of the casing segment (the distance from MPP to EOT) multiplied by a gasified liquid gradient of 0.265 psi/ft. The gradient of 0.265 psi/ft is an experience-based estimate of the effect of accumulated liquids in the wellbore.

We calculate the pressure at sandface using a combination of the gas gradient down the non-flowing side, and an estimate of the pressure drop due to the liquids that have accumulated from EOT to MPP.

After a pressure loss at the sandface is calculated, it is a relatively simple calculation of C. In addition, we calculate what the pressure drop due to accumulated liquids along the flowing side must be to satisfy the fact that the pressure and EOT is equal on both the flowing and non-flowing side.