Fetkovich recognized that decline curve analysis was only applicable during the depletion period (ie. when production is in boundary-dominated flow), and thus the early production life of a well (ie. when production is in transient flow) was not analyzable by the conventional decline curve methods. Fetkovich used analytical flow equations to generate typecurves for transient flow, which he combined with the empirical decline curve equations originally documented by J.J. Arps. For more information, see decline analysis theory. In doing so, Fetkovich presented a new set of typecurves that extended the Arps typecurves into the transient flow region.
Typecurve derivation
The Fetkovich typecurve graph consists of the following two sections which have been blended to be continuous and thereby encompass the entire production life, from transient to boundary-dominated flow:
- Early-time curves (left-side)
- Late-time curves (right-side)
The early-time portion is derived from transient flow equations which come from the field of well-test analysis, whereas the late-time portion consists simply of the Arps typecurve. The common link between the two sections is the exponential decline curve. It is the limiting behavior of all the transient curves when they reach boundary-dominated flow. It is also the first curve in the Arps family of hyperbolic decline curves (b = 0).
Early-time curves
The reservoir that Fetkovich considered in developing the transient flow equations was that of a closed circular reservoir with a well at the center, producing at a constant sandface flowing pressure. The mathematical model has the same standard assumptions as those used when describing reservoirs in the field of well-testing:
- Homogeneous reservoir
- Constant thickness
- Single-phase fluid of constant and small compressibility
- No-flow outer boundary
- Constant flowing pressure at the wellbore
The problem was originally solved by Van Everdingen and Hurst (1949).
The transient portion of the flow rate equations can be represented by numerical curve fit equations (Edwardson et al., 1961). These are given by:


| Note: | These definitions of dimensionless time (tD) and dimensionless rate (qD) are based on well-test applications. For the definitions of these variables as they apply to decline curve analysis, see late-time curves. |
Fetkovich modified the definitions of dimensionless rate and time as follows:


The early-time behavior of the solution to the reservoir problem (transient flow) is the basis of transient well-test analysis, and represents the condition when the reservoir is infinite-acting; when the boundary has not been felt. Obviously transient flow is, by definition, independent of reservoir size; and this would be clearly evident if the flow rate were plotted as dimensionless rate vs. dimensionless time. As shown below, all reservoirs would follow the same curve at early-time and would only deviate at later times, when the reservoir boundary is felt. As the reservoir size increases, transient flow lasts longer, and the deviation to boundary-dominated flow occurs later.

If the same curves were re-plotted on different axes, the shapes would vary significantly. A particularly useful format is to plot dimensionless decline time (tDd) on the x-axis, and dimensionless decline rate (qDd) on the y-axis (see the sub-section late-time curves for definitions of dimensionless decline rate and time). This merges all of the late-time branches into a single curve, because the variable dimensionless reservoir size (re/rw) is now incorporated into the axes. As a result however, the transient data, instead of forming a single line, now becomes a family of lines, with dimensionless reservoir size as a variable as seen below: (Note that this figure represents the early-time portion of the collective Fetkovich typecurves.)

The above figure shows that for all sizes of reservoirs, when transient flow ends, the boundary-dominated flow can be represented by an exponential decline. A well producing at constant pressure will follow one of these curves. One reason for the success of Fetkovich typecurves is that most oil wells are produced at wide-open conditions (ie. at the lowest possible constant pressure). In addition, the above early-time plot gives the impression that by matching the early-time data on one of these curves, it is possible to identify the dimensionless reservoir size. Hence by implication, if the wellbore radius were known, the reservoir size could be determined. However this is a false impression which occurs because of the axes used for plotting. Keep in mind at all times, that the early-time curves represent transient flow, and by definition, the reservoir size cannot be determined from this data alone. If the only data available were in the early-time regime, a unique match could not be obtained. What appears as a possible match on one dimensionless reservoir size curve will also match another dimensionless reservoir size curve at a different location (note that the curves extend to earlier times). An example of a non-unique match of transient data is shown below.

It is only when the production data extends into the boundary-dominated flow region that the different dimensionless reservoir size branches can be used to determine the actual reservoir size. Matching of the data to the typecurves becomes much more unique. Matching of the late-time data gives an indication of the reserves, which in turn is a direct function of the reservoir size. With the knowledge of reservoir size and the match of the transient data, the dimensionless reservoir size parameter can then be used to calculate the effective wellbore radius (rwe), from which the skin factor (s) can be obtained using the following equation:

Late-Time Curves
The boundary-dominated equations, which are used when dimensionless decline time exceeds 0.3, are obtained from the Arps decline equations. The dimensionless quantities used in the Arps dimensionless decline curve are defined differently from those used in the well-test literature. This section will relate the two sets of dimensionless definitions.
In the well-testing domain, dimensionless rate and dimensionless time are defined as follows:

and:

Fetkovich used van Everdingen and Hurst’s solution (1949) to show that during boundary-dominated flow (i.e. when the reservoir boundary has been felt and the reservoir is in depletion), the dimensionless flow rate can be expressed as an exponential function of dimensionless time and dimensionless reservoir size. This equation can be written in terms of the Arps dimensionless exponential decline equation, which is defined as follows:

where:

and:

Using the definitions of dimensionless decline rate and dimensionless decline time in combination with the exponential decline equation, it can be shown that the exponential decline rate (a) is given by:

Thus, Fetkovich has demonstrated that Arps’ empirical exponential decline curve has a solid theoretical basis, as the late-time solution to the "constant wellbore flowing pressure" case. From the above equations, the decline coefficient (a) is seen to be a function of rock and fluid properties as well as drainage size, and is independent of the wellbore flowing pressure (for slightly compressible fluids).
The constant qi for use in the exponential decline equation at t = 0, (qDd = 1) can be calculated from:

If the hyperbolic decline equation:

is presented in graphical form it can be seen to encompass the whole range of conditions from exponential decline (b = 0) to harmonic decline (b = 1), where each value of initial rate (qi), initial nominal decline rate (ai), and decline exponent (b) will produce its own unique curve. Fetkovich generalized these curves by making the equation dimensionless.
He defined a dimensionless decline rate as:

and a dimensionless decline time as:

The resulting dimensionless equation is:

If this equation is plotted using dimensionless decline time and rate as the axes, a unique set of curves is obtained that represents all decline conditions for all wells. Notice that the obtained curves are independent of initial nominal decline rate and initial flow rate when plotted on these dimensionless coordinates.

When these dimensionless curves are plotted on log-log scales as shown below, they are called typecurves, and can be used for graphical analysis of actual production data. (Note that these typecurves represent the late-time portion of the collective Fetkovich typecurves.)

Typecurves can be used for graphical interpretation of a well’s production decline. The production rate of the well is plotted on transparent graph paper of the same scale as the typecurve, and overlain on the typecurve (keeping the axes parallel). The data plot is moved over the typecurves until the best fitting curve is determined. This gives the value of the decline exponent. The values of initial flow rate and initial nominal decline rate are determined by selecting any point on the data plot and the corresponding point on the typecurve. The value of initial flow rate is obtained by dividing the "match point" values off the data plot and the typecurve, qi = ( qt / qDd )match. The value of initial nominal decline rate is obtained by dividing the "match point" values off the typecurve and the data plot, ai = ( tDd / t )match. The production forecast is obtained by tracing the matched curve onto the data plot and extrapolating.
Fetkovich typecurves – combined early and late-time portions
Combining the Fetkovich transient curves (early-time portion) with the Arps decline curves (late-time portion), and blending them where the two sets of curves meet results in the Fetkovich decline typecurves, shown below.

From the Fetkovich typecurve plot it is evident that the transition from transient to depletion behavior occurs at a dimensionless time of 0.1. Until the dimensionless time exceeds 0.1, it is impossible to know the type of decline that ultimately develops.
Fetkovich noted that sometimes the hyperbolic decline coefficient ‘b’, as determined using the Arps decline curves, was larger than 1 (it is normally expected to be between 0 and 1). The explanation that he postulated for this was that the data being analyzed was still in the transient regime, and had not reached the boundary-dominated regime. If data still in the transient flow regime is forced to match a hyperbolic decline, then b-values larger than 1 will result.
Typecurve calculations
Typecurve calculations are described below.
Rate – time typecurves
The actual rate-time data are plotted on a log-log scale of the same size as the typecurves. This plot is called the "data plot". Any convenient units can be used for rate or time because a change in units simply causes a uniform shift of the raw data on a logarithmic scale. It is recommended that daily operated-rates be plotted, and not the monthly rates; especially when transient data are analyzed. However, for very noisy and cyclic data, Fetkovich suggests 6-month averaging of the data. In addition, a log-log plot of the cumulative production data vs. time, if matched simultaneously with the rate data, should help in achieving a more unique match of the data with the typecurves.
The data plot is moved over the typecurve plot, while the axes of the two plots are kept parallel, until a good match is obtained. The rate and the cumulative data should both fit the same corresponding typecurve. Several different typecurves should be tried to obtain the best fit of all the data. The typecurve that best fits the data is selected and its "re/rwa" and "b" vales are noted.
To make a forecast, the selected typecurve is traced on to the data plot, and extrapolated beyond the last data points. The future rate is then read from the data plot off the traced typecurve.
Typecurve analysis is done by selecting a match point and reading its co-ordinates off the data plot (q and t)match, and off the typecurve plot (qDd and tDd)match. At the same time the stem values ("re/rwa" and "b") of the matching curve are noted.
From the right-hand-set of typecurves, the following decline curve parameters can be obtained:


The subscript 'f’ denotes conditions at the beginning of the forecast period.
With these, we can now calculate the expected ultimate recovery.
Exponential


Hyperbolic


Harmonic


Now, we can estimate fluid-in-place and drainage area.
Oil


Gas


From the left-hand set of typecurves, the reservoir parameters can be obtained if initial reservoir pressure, wellbore flowing pressure, net pay, total compressibility, and wellbore radius are known.

Permeability is obtained by rearranging the definition of dimensionless decline rate:


Permeability can be also obtained by rearranging the definition of dimensionless decline rate as follows:


Solve for apparent wellbore radius from the definition of dimensionless decline time:


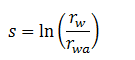
Skin factor is calculated as follows:
Cumulative – time typecurves
Production data is often quite noisy, and thus difficult to analyze. To reduce the effect of this noise, the cumulative production can be used. It is a smoother curve than production data and can make the analysis more reliable. Fraim and Lee developed cumulative typecurves of dimensionless cumulative decline production (QDd) vs. dimensionless decline time (tDd); where the dimensionless cumulative decline production is defined as the ratio of cumulative production to the ultimate movable fluid.
Oil

Gas

where (oil and gas):


From the Fetkovich typecurves, the rate can be integrated to determine the cumulative production, and plotted in typecurve format.

Cumulative graphs show that, at dimensionless decline time (tDd) = 100, harmonic decline leads to five times more cumulative production as compared to exponential decline.
The authors indicated that the dimensionless decline time-function used for the cumulative plots above has 3/4 in the denominator, whereas in the Fetkovich type curves, the dimensionless decline time-function has 1/2 in the denominator. The factor 3/4 appears in the inflow equation when the drawdown is referenced to the average reservoir pressure, and the factor 1/2 appears when the reference is the initial pressure at reservoir radius (re). Fetkovich tried using 1/2, 5/8, and 3/4; and found that using 1/2 reduced the discontinuity between the transient stems and the hyperbolic stems.
Typecurve equations
Typecurve equations are described below.
Cumulative typecurves
Fraim and Lee (1987), and Spivey et al. (1992) provide detailed equations for generating the transient and the boundary-dominated stems of the cumulative production typecurves. Transient flow rate and cumulative production are reported as functions of time by Edwardson et al. (1961). The cumulative values are given by:


The well test-based dimensionless cumulative production (QD) and dimensionless time (tD) are converted to decline-based dimensionless cumulative production (QDd) and decline-based dimensionless time (tDd) by:


The transition from transient equations to boundary-dominated flow equations for cumulative production occurs at tDd = 0.6.
Boundary-dominated flow is obtained from the following equations:
Exponential

Hyperbolic

Harmonic

Cumulative / derivative typecurves
Spivey et al. showed that typecurves of cumulative production can be combined with their (semi-log) derivative to give a set of typecurves that uses only cumulative production data and not rate. Because cumulative production tends to be much smoother than the original rate data, these plots tend to have less scatter than the traditional Fetkovich typecurves. The derivative typecurves are obtained from:

This can be shown to be mathematically equivalent to:

and, in dimensionless form:

Simply multiplying the rate by time gives the semi-log derivative of cumulative production. The typecurve plot of cumulative production and its derivative are shown in the following plot.

Rate-integral typecurves
Blasingame et al. (1989) introduced the concept of integral typecurves in the field of well testing. Spivey et al. (1992) extended the concept to decline curve analysis, and they state that as production data is usually very noisy, plotting a rate-integral or cumulative production should reduce the noise and make the data much more analyzable. The rate-integral is related to the cumulative production, and is defined as:

and, in dimensionless form:

The rate-integral is obtained by dividing the cumulative production by the time of flow, as seen in the equations above. The direct physical interpretation of the rate-integral is the average production rate, from the beginning of production to the current time. The relationship between rate and rate-integral is shown in the following diagram:

It is seen above that the rate and the rate-integral have very similar characteristics. The advantage of the rate-integral is that it tends to be smoother and less noisy than the rate data. This is consistent with the fact that the rate-integral is essentially a time-dependent average rate, and like all averaging, is less noisy than the original data.
Matching equations (variable flowing pressure)
Matching equations are described below.
Oil
The Fetkovich typecurve matching equations can be extended for use with production at variable flowing pressure. Instead of simply plotting production rate, normalized rate (q / ∆p) is plotted.
Permeability is obtained by rearranging the definition of dimensionless decline rate:


where q / Δp and qDd are read off the raw data and typecurve graphs at a selected match point.
Solve for apparent wellbore radius from the definition of dimensionless decline time:


Finally, skin factor can be calculated as follows:

For exponential, hyperbolic and harmonic, expected ultimate recovery is calculated as follows:
Exponential


It is assumed that the flowing pressure is constant during the forecast period, and this constant flowing pressure (pwf)forecast should be entered for analysis.
Hyperbolic


Harmonic


Gas
Permeability is obtained by rearranging the definition of dimensionless decline rate:


Where q / Δpp and qDd are read off the raw data and typecurve graphs at a selected match point.
Solve for apparent wellbore radius from the definition of dimensionless decline time:


Finally, skin factor can be calculated as follows:

For exponential, hyperbolic and harmonic, expected ultimate recovery is calculated as follows:
Exponential


It is assumed that the flowing pressure is constant during the forecast period, and this constant flowing pressure (pwf)forecast should be entered for analysis.
Hyperbolic


Harmonic


Matching equations (normalized data)
In this analysis, normalized rate and normalized cumulative production are used for analysis instead of rate and cumulative production. The same typecurves are used for analysis as for Fetkovich analysis but the equations to calculate reservoir parameters and reserves are slightly different.
Normalized rate and normalized cumulative production are defined as follows:
Normalized rate: oil

Normalized rate: gas

Normalized cumulative production: oil

Normalized cumulative production: gas
