Water-oil ratio (WOR) forecasting is a method of trending future water production for the purpose of forecasting oil production and determining expected ultimate recoverable s (EUR). Water-oil ratio forecasting is an empirical analysis method; there is no formal model or equations. Plots of both water-oil ratio and water-oil ratio +1 are used in forecasting, and the plots are typically semi-log with cumulative oil production as the x-axis. Water-oil ratio, water-oil ratio +1, and water cut are defined below:


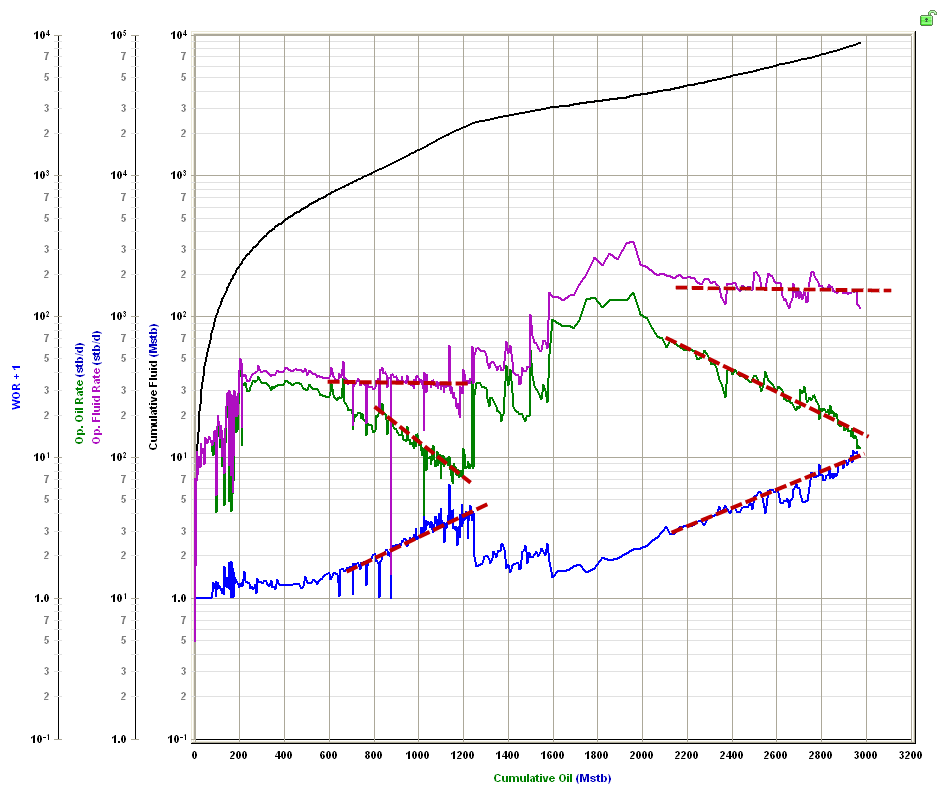
Ratio interpretation in combination with rate interpretation (traditional decline analysis) can increase confidence in the forecasts. In exponential or harmonic rate decline, slope dependencies are often observed between the rate and ratio trends. By plotting a forecast on both rate and ratio data, the slope dependencies can be used to match historical data on both the rate and ratio trends. These interpretations are less likely to show personal bias, as the forecast would only look reasonable if it matched both trends. Exponential decline is best analyzed on a semi-log plot of a water-oil ratio or a water-oil ratio +1 vs. time. Harmonic decline is best analyzed on a semi-log plot of a water-oil ratio or a water-oil ratio +1 vs. cumulative oil. The plot below shows slope dependence (the rate slope is the inverse of the ratio slope) between the oil rate and the water-oil ratio +1, while the total fluid rate (oil + water) is constant.
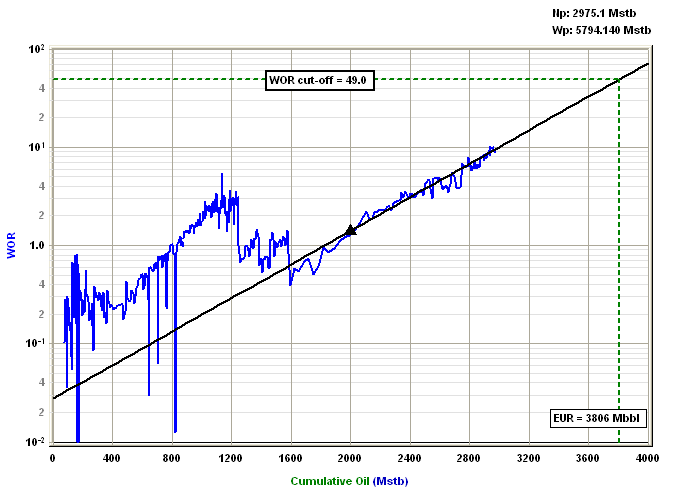
The WOR and WOR +1 are often used interchangeably. The advantage of WOR +1 in some situations is that periods with zero water production can be plotted. In some cases, the ratio trend appears more linear on WOR or WOR +1. It could be that the WOR behaves linearly when water rates are constant, and WOR +1 behaves linearly when total fluid rates are constant. This may guide you in determining which plot to select, but both should be considered uncertain. To create the forecast, a linear trend is placed on the WOR or WOR +1 semi-log plot, and a maximum WOR or water cut is used to truncate the forecast. An oil rate forecast is calculated by combining the ratio forecast with a total fluid rate.
Water-oil ratio forecasting provides the most useful result in water drive or waterflood scenarios (for example, scenarios with high water production). However, linearizing the data removes the diagnostic aspects that may be desired for these reservoirs and production scenarios. Similar to decline forecasts, the trends created with WOR plots should be considered under constant operating conditions. Changing conditions, such as infill drilling or recompletions, often appear as changing the slope in the WOR trend.