Return to the data diagnostics flowchart
Examine the rate & pressure vs. time (Cartesian) plot to answer the following questions:
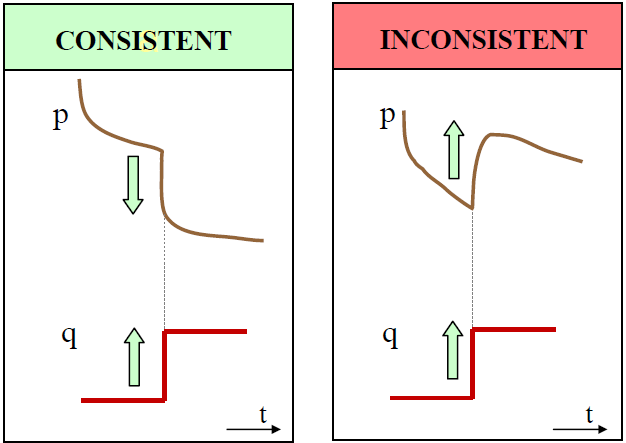
- Do step changes in pressure and rate correlate with each other?
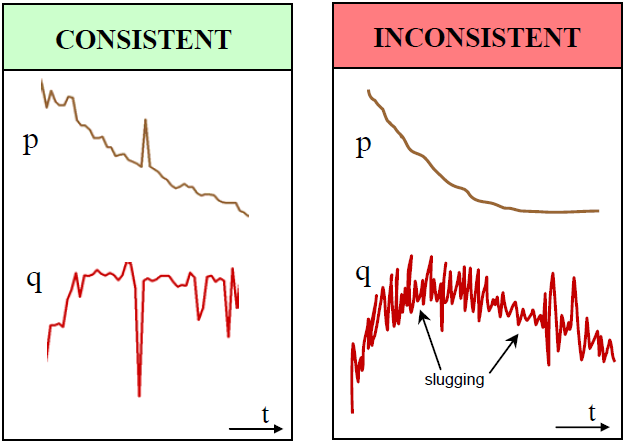
- Is the general trend in the rate reflected in the pressure, and vice versa?
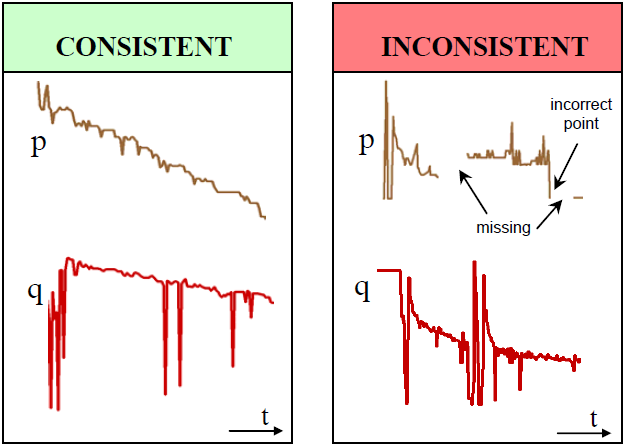
- Is the production rate and pressure data stable?
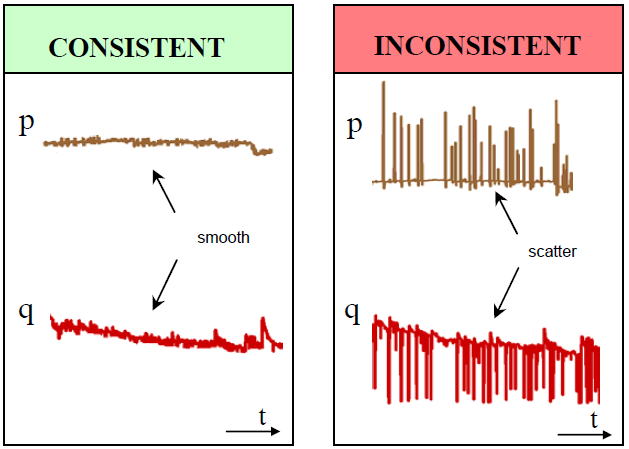
- Is the rate and pressure data smooth, continuous, and free of scatter?
Do step changes in pressure and rate correlate with each other?
|
Reasons for inconsistencies: Incorrect pressure
|

|
Incorrect rate
Time periods
|
Is the general trend in the rate reflected in the pressure, and vice versa?

|
Reasons for inconsistencies:
|
Is the production rate and pressure data stable?
|
Reasons for inconsistencies:
|
Is the rate and pressure data smooth, continuous, and free of scatter?
|
Reasons for inconsistencies:
|
|
|