When the objective is to determine the optimal way to complete a well, a common method is nodal analysis. Nodal analysis combines two separate concepts, inflow performance relationship (IPR) and tubing performance curve (TPC), and plots them on the same chart where you can see how each well may operate under a number of conditions. Since both the IPR and TPC are calculated independently, the theory for each concept is described separately below. For information on this analysis, see Oil IPR / TPC.
TPC
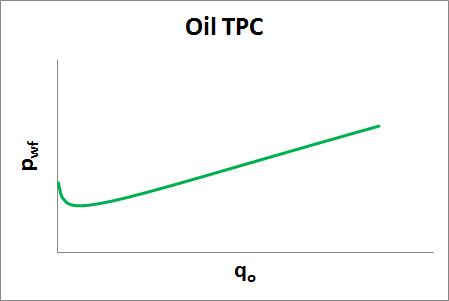
A TPC is a graphical representation of the pressure response of a wellbore completion to a range of fluid rates. The TPC is plotted as a relationship between sandface flowing pressure versus oil rate.
The inputs needed to create a TPC are as follows:
- Wellhead pressure
- Ratios (GOR and WOR)
- A valid wellbore configuration
See the Wellbore editor for details. - Valid fluid properties
See the Properties editor for details.
Using these inputs, a series of pressure loss calculations are done over a range of oil rates, and then a line is drawn through all the points to create a curve. The default setting is to plot 64 points, using equally spaced oil rates up to a maximum rate. The maximum oil rate is defined by the largest IPR.
IPR
Flow into a well depends on both the reservoir characteristics and the sandface flowing pressure. The relationship of inflow rate to sandface flowing pressure is called the inflow performance relationship (IPR). Harmony Enterprise presents this relationship in the form of a pressure versus flow rate plot. From this plot, the well’s flow potential can be determined at various flowing sandface pressures.
Straight line IPR
In calculating oil well production, it is assumed that producing rates are proportional to the pressure drawdown. Using this assumption, a well’s behavior can be described by its productivity index (PI) as follows:

This relationship was developed from Darcy’s law for the steady-state radial flow of a single, incompressible liquid. An example of a straight line IPR is shown below.
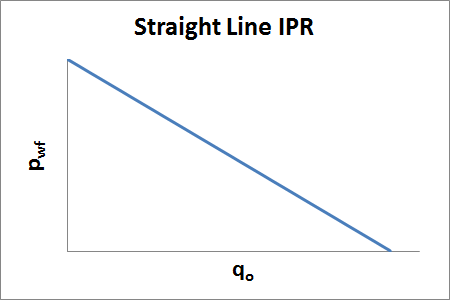
In order for oil to flow from the surrounding reservoir towards the wellbore, there must be a pressure drawdown. Consequently, if the flowing sandface pressure (pwf) is equal to the reservoir pressure (pR), then no oil flows from the reservoir to the wellbore, and therefore the rate is zero. Consequently, for any IPR plot, the y-axis intercept is essentially an indicator of the reservoir pressure.
Likewise, if the sandface pressure is zero, then the drawdown would be at its maximum value, indicating the theoretical maximum rate that the reservoir could deliver to the well. This maximum rate is sometimes referred to as the absolute open flow potential (AOFP), and is indicated by the x-axis intercept on the plot. Since an absolute sandface pressure of zero is a physical impossibility, the AOFP cannot be measured. Instead, a test is performed to measure the rate that the reservoir delivers at some intermediate sandface pressure. This test information, along with the reservoir pressure, is used to determine the productivity index. Consequently, the AOFP can be calculated from the productivity index equation.
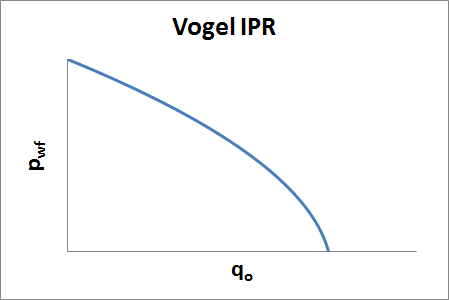
Vogel IPR
While a straight line IPR is quite applicable for single-phase liquid systems (for example, a water reservoir), it is less accurate for two-phase systems. Since reservoir oil contains dissolved natural gas, and this gas evolves from the oil below the bubble point pressure (pbp), a two-phase scenario is a common occurrence in an oil reservoir.
Vogel developed the following empirical equation to account for two-phase flow.
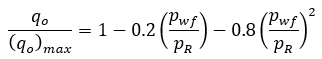
where:
qo = Oil rate, stb/d
(qo)max = Maximum oil rate, stb/d
pwf = Flowing sandface pressure, psi(a)
pR = Average reservoir pressure, psi(a)
An example is shown below.
IPR with single-phase and two-phase flow
Vogel's equation was derived for reservoirs where the bubble point pressure was equal to the reservoir pressure. For undersaturated reservoirs (that is, where reservoir pressure is higher than bubble point pressure), the straight line IPR equation applies for sandface pressures above pbp while the Vogel IPR equation applies for pressures below pbp.
Custom IPR best-fit algorithms
With a Harmony Optimize license, there are several methods to best-fit custom data points for an IPR. All methods require that you input the current reservoir pressure, and that the oil properties have a valid entry for bubble-point pressure.
Vogel-based fit
This method matches your data to the Vogel and straight-line IPR equations described above. A minimum of one data point is required.
Fetkovich-based fit
This method matches your data to the Fetkovich equation. A minimum of two data points are required. The generalized Fetkovich equation is as follows:
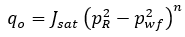
where:
qo = Oil rate, stb/d
Jsat = Productivity index , stb/d/psi(a)n
pwf = Flowing sandface pressure, psi(a)
pR = Average reservoir pressure, psi(a)
n = Flow exponent
Linear fit
This method draws an IPR as a series of straight lines between each entered data point. This simple fit does not extrapolate input points to maximum rate, and does not allow for an increase in slope (off-trend data points). However, a linear fit can honor the counter-intuitive test points taken from transient and low-permeability wells more closely than with the empirical-based fits.