The voidage replacement ratio (VRR) analysis helps identify parts of a field where increased or decreased amounts of water or gas must be injected in order to reach or maintain VRR targets.
A VRR analysis can display both the instantaneous VRR and cumulative VRR for both water injection and gas injection. The VRR datasets can be plotted versus Time, Cumulative Oil Produced, or Cumulative Water Injected.
To create a VRR worksheet using water injection, the injected values must be entered in Water Inj Volume in the Production editor for individual wells. To create a VRR worksheet using CO2 injection, the injected values must be entered in Gas Inj Volume (also in the Production editor). Currently, steam injection volumes are not incorporated in VRR calculations. Optionally, the well could also contain "time on injection".
This worksheet has these buttons in the lower left: Patterns and VRR Settings. If you do not see all these buttons, click >> and select Show All Buttons.
Patterns
When you create a new worksheet, all wells are listed in the Unassigned category. Patterns are used to subdivide the wells into groups that are hydraulically connected and usually center around one injector, and the producers it affects or visa versa. These patterns can be created by selecting wells in the list or in the map view, and creating a new pattern or adding and removing wells from existing patterns.
Creating patterns
To create a new pattern in the Patterns pane:
1. Select wells in the Unassigned category. Pressing the Shift and Ctrl keys on the keyboard can be used to select multiple wells.
2. Click the Add Entity icon (![]() ) and select Create Pattern from selected.
) and select Create Pattern from selected.
Or, right-click one of the selected wells and select Move Selected Items, then select (New Pattern).
To create a new pattern on the map view:
1. Select wells on the map by clicking the Area Select (![]() ) icon or Lasso Select (
) icon or Lasso Select (![]() ) icon.
) icon.
2. Click the Create Pattern button in the map toolbar.
Modifying patterns
To modify a pattern:
1. Right-click in the Pattern pane.
2. Select one of the following options:
- Rename Pattern — changes the display name of the pattern in the left pane and on the map. A unique name must be used.
- Edit Pattern Color — changes the display color of the pattern in the left pane and on the map.
Patterns can be deleted by selecting the pattern and clicking the Remove Selected Entities (![]() ) icon.
) icon.
VRR settings
VRR settings are as follows:
Pressure Source — determines the pressure used when determining the fluid properties (Bo, Bg, Bw, Rs) in each period when calculating VRR.
- Use Constant Pressure — type a constant reservoir pressure, or use the default value (of Pi from the Properties editor).
- Use Oil Material Balance Analysis — select your analysis from the drop-down list and the synthetic reservoir pressure over time is applied to the VRR calculations.
Target — by default, each VRR analysis displays a straight dashed Target VRR line at VRR = 1. This is a visual indicator of the relationship between the VRR datasets and your specified target. To display the target VRR line, click the Show on plot checkbox. You can change the Target VRR value by typing a new value in the VRRTARGET field.
Note: The Target VRR is based on good reservoir practice.
Pre-Injection Production — the cumulative VRR dataset can include pre-injection production (default setting), or exclude it. When pre-injection production is included, the cumulative VRR reflects the relationship between injected fluids and produced fluids since the beginning of production. When pre-injection production is excluded, the cumulative VRR reflects the relationship between injected fluids and produced fluids since the beginning of injection.
Allocation
Clicking the Allocation button opens the Pattern Allocation dialog box, which displays the loss factors and pattern allocations for all wells in the group. Loss factors are only applied to injection volumes for a well and allow for partial accounting of the total injection in the VRR calculations. The loss factors default to zero. Allocation splits the production and injection of a well when it is included in multiple patterns. The allocation is 1.0 for the first pattern a well is added to, and zero for subsequent patterns. The allocation cell is blank and disabled for any pattern for which the well is not a member.
Auto Allocate button — automatically sets well allocation to an arithmetic average based on the total number of patterns to which it is a member. For example, if a well is in two patterns, the allocation is set to 0.5 in each pattern.
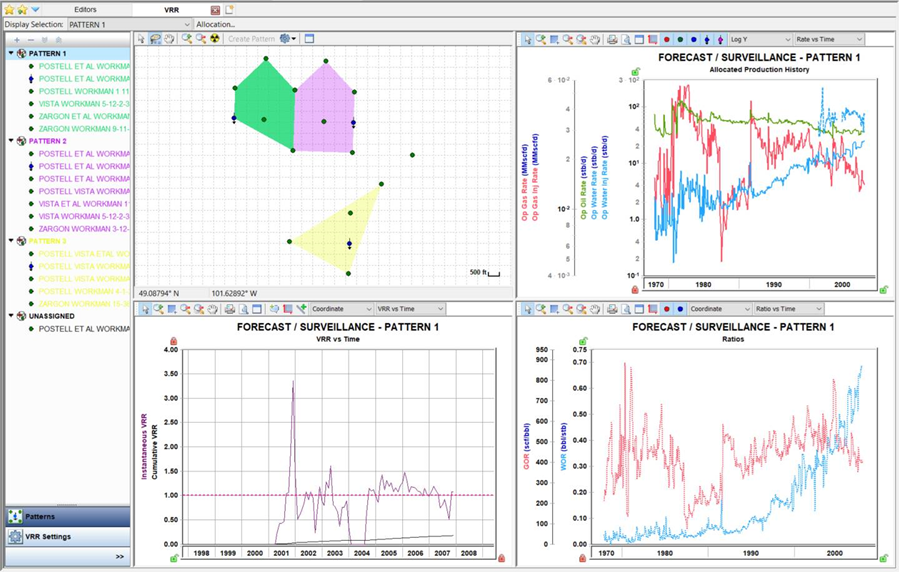
Dashboard
In the dashboard, there are four plots.
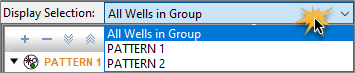
The VRR, Production History, and Ratios plots can display datasets for all wells in the VRR group, or for a certain pattern based on the selection in the following drop-down list:
For a description of common plot icons, see plot toolbars.
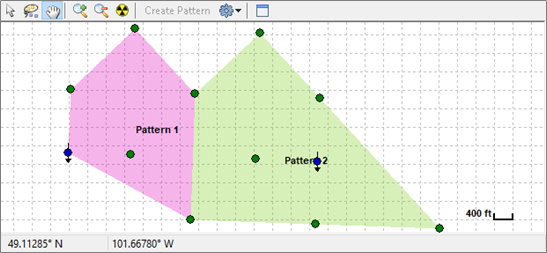
Map view
The map view displays all wells in the VRR group and all created patterns.
Toolbar icons are as follows:
-
 Create Pattern — creates a pattern from the selected wells.
 -
 Display Settings — clicking this icon displays a drop-down list with the following options: Wells, Well Names, Well Head, Grid, Scale, Patterns, Pattern Names, and Show All.
VRR plot
This plot displays Instantaneous VRR and Cumulative VRR for the selected pattern.
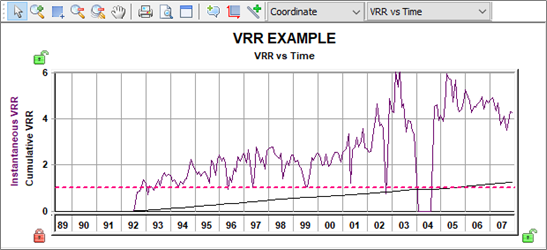
Click the 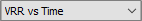 drop-down list to switch between various plot views: VRR vs Time, VRR vs Cum Oil, and VRR vs Cum Water Inj.
Lines on the plot represent the following:
- Dashed pink line — represents the target VRR. This parameter can be changed in VRR settings.
- Solid lines — represent the VRR datasets (purple = instantaneous, black = cumulative).
Production History plot
This plot displays historical production and injection rates for the selected pattern.
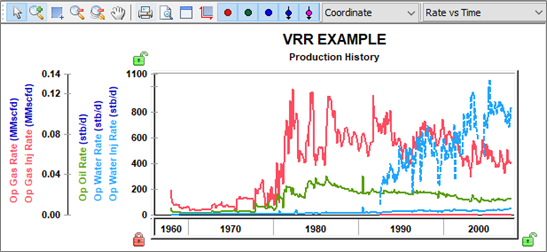
The Well Symbol icons (![]() ) are used to show or hide individual datasets on the plot.
) are used to show or hide individual datasets on the plot.
Ratios plot
This plot displays historical ratios for the selected pattern.
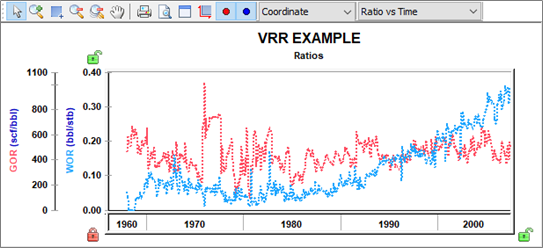
The Well Symbol icons (![]() ) are used to show or hide individual datasets on the plot.
) are used to show or hide individual datasets on the plot.