In the Production editor (located within the Editors pane), you can manipulate imported production and flowing pressure data, and create new production records. To open the Production editor, click Production at the bottom of the pane.
The required inputs for calculating sandface pressure (including auto-calculated sandface pressure) are:
1. A complete wellbore (wellhead + sandface temperature, casing, tubing (if flow path !=casing), datum).
2. Properties for the fluids being produced (gas, oil, water, and condensate).
3. An active pressure (set by Pressure Source; either casing, tubing, gauge depth, or imported sandface pressure).
4. Production for the fluids being produced (although sandface pressures are calculated without production / assumed to be shut-in)
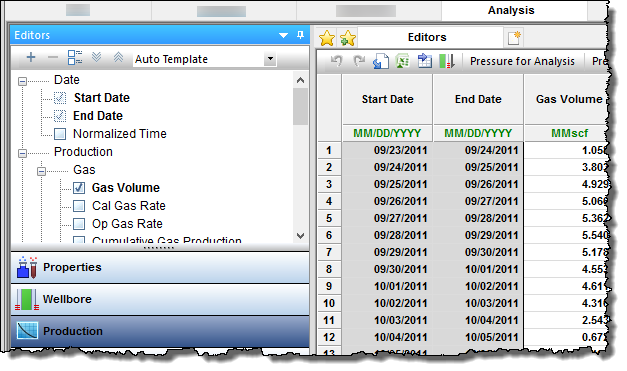
The Production editor consists of the following parts:
Toolbars
The Production editor has two toolbars: primary and secondary. The unique items are described below; for a description of common icons, see toolbars.
Primary toolbar
The primary toolbar for the Production editor is located directly below the Editors pane.
Clicking the + icon on this toolbar lists two options.
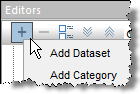
- Add Dataset — opens the Create Custom Dataset dialog box. You can create two different types of custom datasets: input (using values you enter) and calculated (using equations you enter). The selection tree updates after you add your dataset and your update is viewable on the Plot Selection pane and Diagnostics tab.
- Add Category — opens the Create Custom Category dialog box where you can create custom categories to group your data. The selection tree updates after you add your category and your update is viewable on the Plot Selection pane and Diagnostics tab.
You can click the – icon after selecting the custom dataset or category you want to delete. You are prompted to confirm your decision when deleting a custom dataset, but a custom category is immediately deleted.
After you have customized the table / grid display to your liking, you can save your configuration as a template for re-use. Click the drop-down arrow on the toolbar and select Save / Delete Template. To load a previously saved template, select it from the drop-down list.
![]()
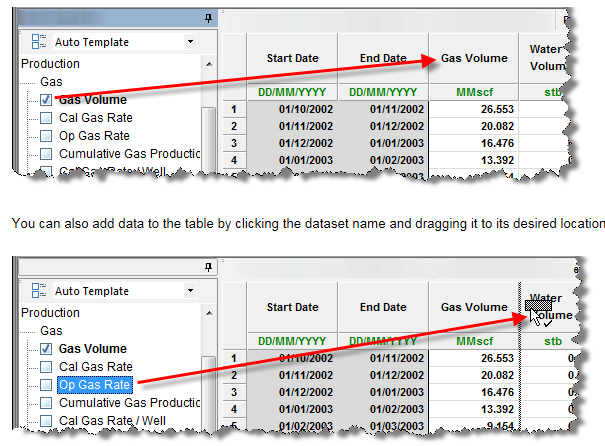
If you select Auto Template (default setting), the following columns are displayed, if they have data:
- Gas Volume
- Oil Volume
- Water Volume
- Cond Volume
- CO2 Volume
- Gas Lift Inj Volume
- Gas Inj Volume
- Water Inj Volume
- Casing Pressure
- Tubing Pressure
- Line Pressure
- Gauge Depth Pressure
- Imported Sandface Pressure
The following Flowing Pressure columns are displayed, if at least one of these columns has data: casing pressure, tubing pressure, gauge depth pressure, or imported sandface pressure:
- Pressure Source
- Active Pressure
- Calculated Sandface Pressure
The following columns are displayed if any wellbore configuration has the Flow Path set to "Pumping":
- Gas Volume
- Casing Pressure
- Pressure Source
- Active Pressure
- Calculated Sandface Pressure
- Liquid Level (MD)
- Liquid Level (TVD)
- Average Liquid Gradient
- Gas Gradient
- Oil Gradient
- Water Gradient
Downhole gauge pressure data can be used to calculate the sandface pressure. This functionality is only available for Tubing, Pumping and Casing flowpaths with the following assumption: gauge and tubing are landed above datum (MPP).
Note: For the pumping flowpath the gauge cannot be above the end of tubing (EOT).
Secondary toolbar
This editor has the following important icons on its secondary toolbar (to the right of the Editors pane):
-
 Add Data — adds data to the current well. Select either:
- Enter Data — opens the Import Data dialog box where you assign column headers (by clicking the drop-down arrows) and type in your data.
- Import Data — browse to the undefined text file (for example, .csv, .txt, etc.) you want to import. For more information, see import well data from a file.
-
 Prior Production — loads prior production data into the table.
 -
 Calculate Sandface Pressure — calculates sandface pressure each time you click this icon.
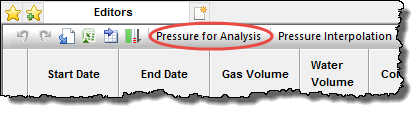
 - Pressure for Analysis — select either Use Active Pressure or Use Calculated Sandface Pressure. For more information, see pressure for analysis.
- Pressure Interpolation — select either Linear (affects Custom CGR and Liquid Level MD columns) or Step (affects Pressure Source and CGR Source columns). Interpolated pressures are displayed in gray and populate rows that have not been specified. For more information, see pressure interpolation.
Pressure for analysis
With this option, you can specify which flowing pressure is used in any analyses with calculations that require this value (for example, analytical models, etc).
The Pressure for Analysis option is located in the toolbar of the Production Editor grid.
When selected, there are two options to choose from:
1. Use Active Pressure — uses the pressure that has been set under the Pressure Source column of the grid (that is, casing, tubing, gauge depth, or imported sandface pressure) as the flowing pressure in analyses.
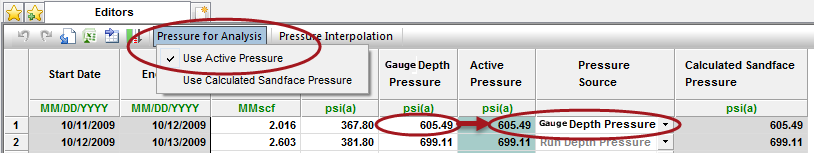
Note: If active pressure has been set to a wellhead pressure (for example, tubing pressure), and "Use Active Pressure" has been selected, all analyses will use the tubing pressure as the flowing pressure in calculations. This could result in significant differences in results compared to using a calculated sandface flowing pressure. If imported sandface pressures are not available, we recommend calculating a sandface pressure and setting the pressure for analysis to "Use Calculated Sandface Pressure".
2. Use Calculated Sandface Pressure — uses the calculated sandface pressure in the Production editor for flowing pressure in analyses. This is the default selection.
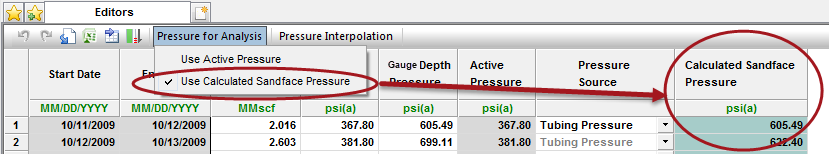
Note: A valid wellbore is needed to calculate sandface pressures.
The pressure used in analyses is highlighted in turquoise.
Pressure interpolation
Flowing-pressure columns are interpolated based on whether you select Linear or Step. If the table cell is in the bottom row, and you press the Enter or Tab keys, the cell selection does not change. This affects these columns: Casing Head Pressure, Tubing Pressure, Gauge Depth Pressure, and AWS Wellhead Pressure.
For both Linear and Step, all rows prior to the first-specified value are set to the first-specified value. All rows after a specified value are set to the last-specified value.
For the step method, all rows after a specified value are set to the specified value until the next specified value.
For the linear method, all rows between two specified values are linearly interpolated. Linear interpolation is calculated at the mid-period for each row. The table below demonstrates this interpolation. (Cells in gray have been calculated or interpolated.)
| Start Date | End Date | Value | Mid-period Date |
|---|---|---|---|
| 2010/01/01 | 2010/02/01 | 100.00 | 2010/01/16 12:00:00 |
| 2010/02/01 | 2010/03/01 | 132.96 | 2010/02/15 00:00:00 |
| 2010/03/01 | 2010/04/01 | 165.92 | 2010/03/16 12:00:00 |
| 2010/04/01 | 2010/05/01 | 200.00 | 2010/04/16 00:00:00 |
For more information, see interpolation theory.
Selection tree
The selection tree has production / injection, flowing pressure, and other data reported by date / time. To display data in the table to the right, click your dataset's checkbox in the tree structure. Deselecting a dataset's checkbox removes it from the table.
If you want to rename a custom dataset or category, right-click it in the selection tree and select Rename. (You can add these custom datasets and categories using the primary toolbar.)
Grid (table)
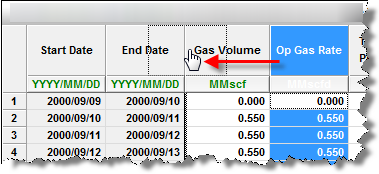
The grid (or table), located on the right-side of the Production editor, displays the selected entity's production data. The Start Date and End Data columns are always displayed as the leftmost columns in the grid, and cannot be moved or removed. All of the other columns can be shown / hidden by selecting / deselecting the parameter's name in the selection tree, or by moving the parameter within the grid.
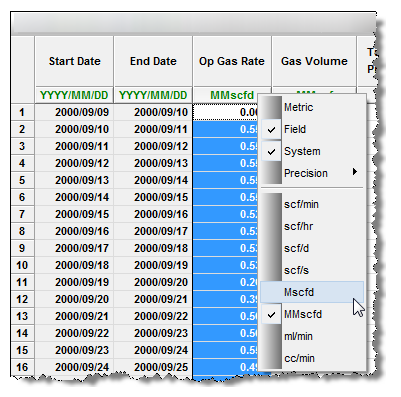
To change the units, click the unit sub-header and select from the list. You can also set precision.
Fields with a white background can be edited by typing within the field, or pasting from another source (for example, Excel).
Note: If you select multiple wells, or a well group in the Entity Viewer, you cannot edit any of the fields. Gray fields (including cumulative production, ratios, and aggregates) are read-only.
To remove a row from the grid, right-click the row number and select Remove Row. You can only remove rows at the end of production.