The GIS map displays entities (wells and groups) as long as their attributes include geographical coordinates.
When you mouse over the GIS map, the status bar displays the latitude, longitude, and dominion land survey (DLS) at the current location.
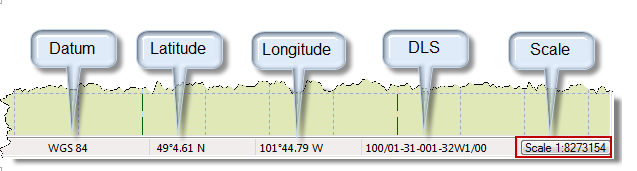
The GIS map supports three datum systems / projections:
1. NAD 27 (North American Datum, created in 1927)
2. NAD 83 (North American Datum, modified in 1983)
3. WGS 84 (World Geodetic System, modified in 1984)
To create new facilities, click the icons located on the GIS design mode tools toolbar. If you want other options (for example, setting a flag), right-click the well on the map.
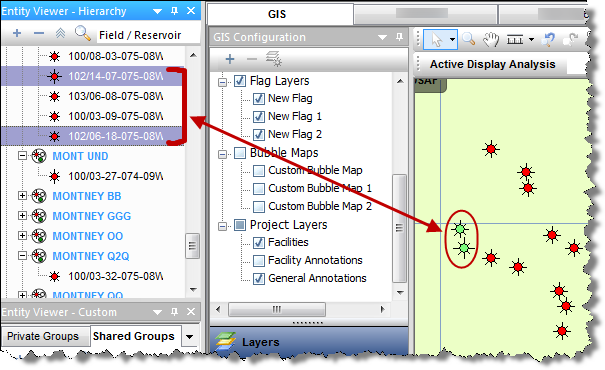
When you select a well on the map, it is synchronized with the Entity Viewer and vice versa. Selected wells are highlighted in the Entity Viewer and are displayed in light green on the GIS map.
Context menus
If you right-click the map, you can add a general annotation by selecting Create General Annotation. This anchors the annotation at the point on the map you clicked.
If you right-click an annotation, you can edit it.
If you right-click a well on the map, these options are displayed:
- Flags
- Create New Flag — adds a flag layer for this well and displays the flag properties in the GIS Configuration pane.
- Delete Flag — deletes the flag for this well.
- Add Selection to Flag — select your flag from the submenu.
- Remove Selection from Flag — this option is enabled if a flag layer is already in place. Delete the appropriate flag by selecting it from the submenu.
- Flag Properties — displays the flag properties in the GIS Configuration pane.
- Bubble Maps
- Create New Bubble Map — opens a dialog box where you can create and customize your bubble map.
- Add to Bubble Map — select your bubble map from the submenu.
- Remove From Bubble Map — this option is enabled if a bubble map is already in place. Delete the appropriate bubble map by selecting it from the submenu.