When you click various tabs, a different subset of information is displayed in the main pane for the selections in the Entity Viewer (Hierarchy or Custom). The geographic information system (GIS) tab displays the location of the entities on a world map, if the location attribute fields are populated, while the Attributes tab displays the meta-data associated with the selected entities. Datasets associated with the selected entities can be viewed from the Diagnostics tab.
The following examples describe how you can preview wells, or groups of wells, on these tabs: GIS, Attributes, and Diagnostics.
GIS well preview
To preview a well in the GIS tab:
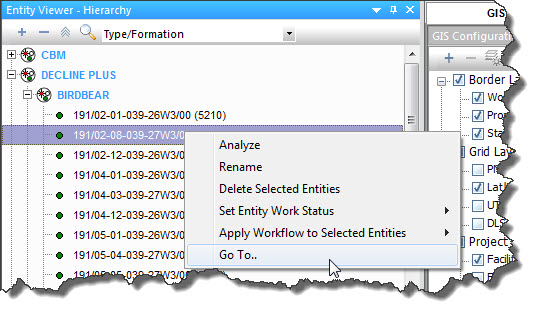
1. Select the well in the Entity Viewer (Hierarchy or Custom).
2. Right-click the well and select Go to.

The GIS zooms in towards the selected well and highlights it.
Note: Entities that do not have values recorded for their location attributes are not displayed in the GIS.
Attributes well preview
To preview well attributes:
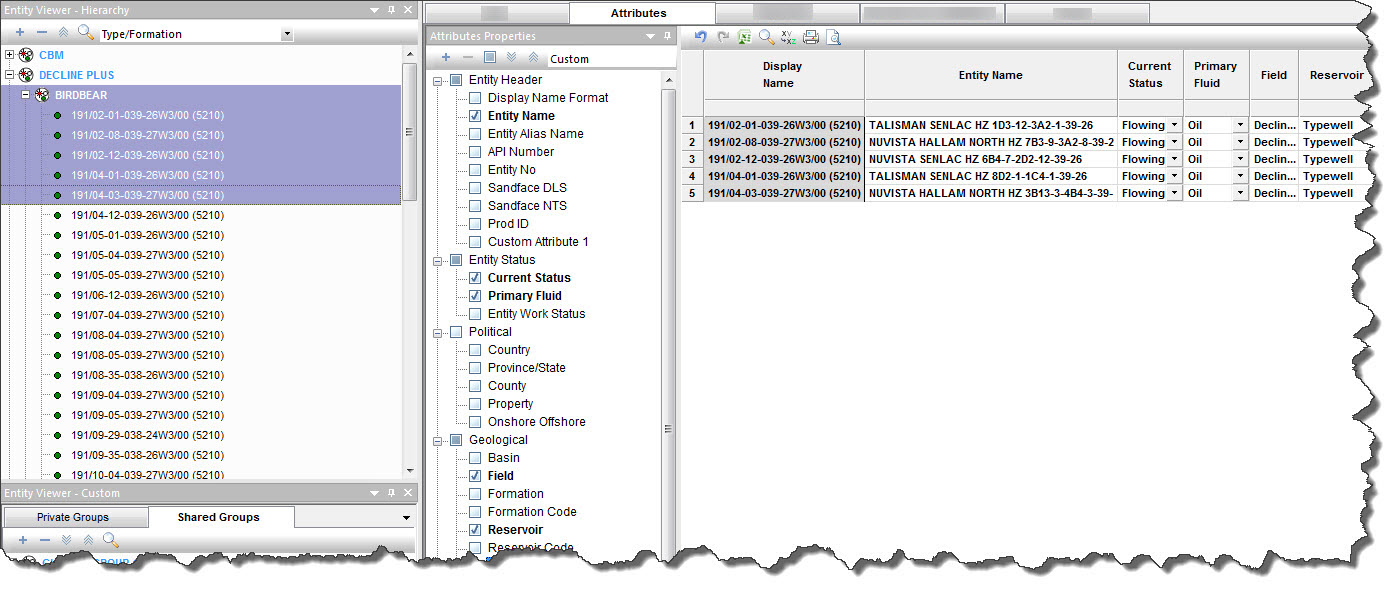
1. Select the well (or multiple wells) in the Entity Viewer (Hierarchy or Custom).
2. Click the Attributes tab.
By default, the auto template displays the following attributes: Display name, Entity Name, API Number, Entity No, Current Status, Primary Fluid, Country, Province / State, Field, Reservoir, and Unit.
3. Select the attributes you want to view from the Attributes Properties tree structure by clicking the checkboxes next to the attribute. (Selecting a category displays all of the attributes in the category.)

Note: Attributes are not displayed for groups; therefore, a selection that includes both groups and wells only displays the well attribute data.
Diagnostics well preview
To preview well production data:
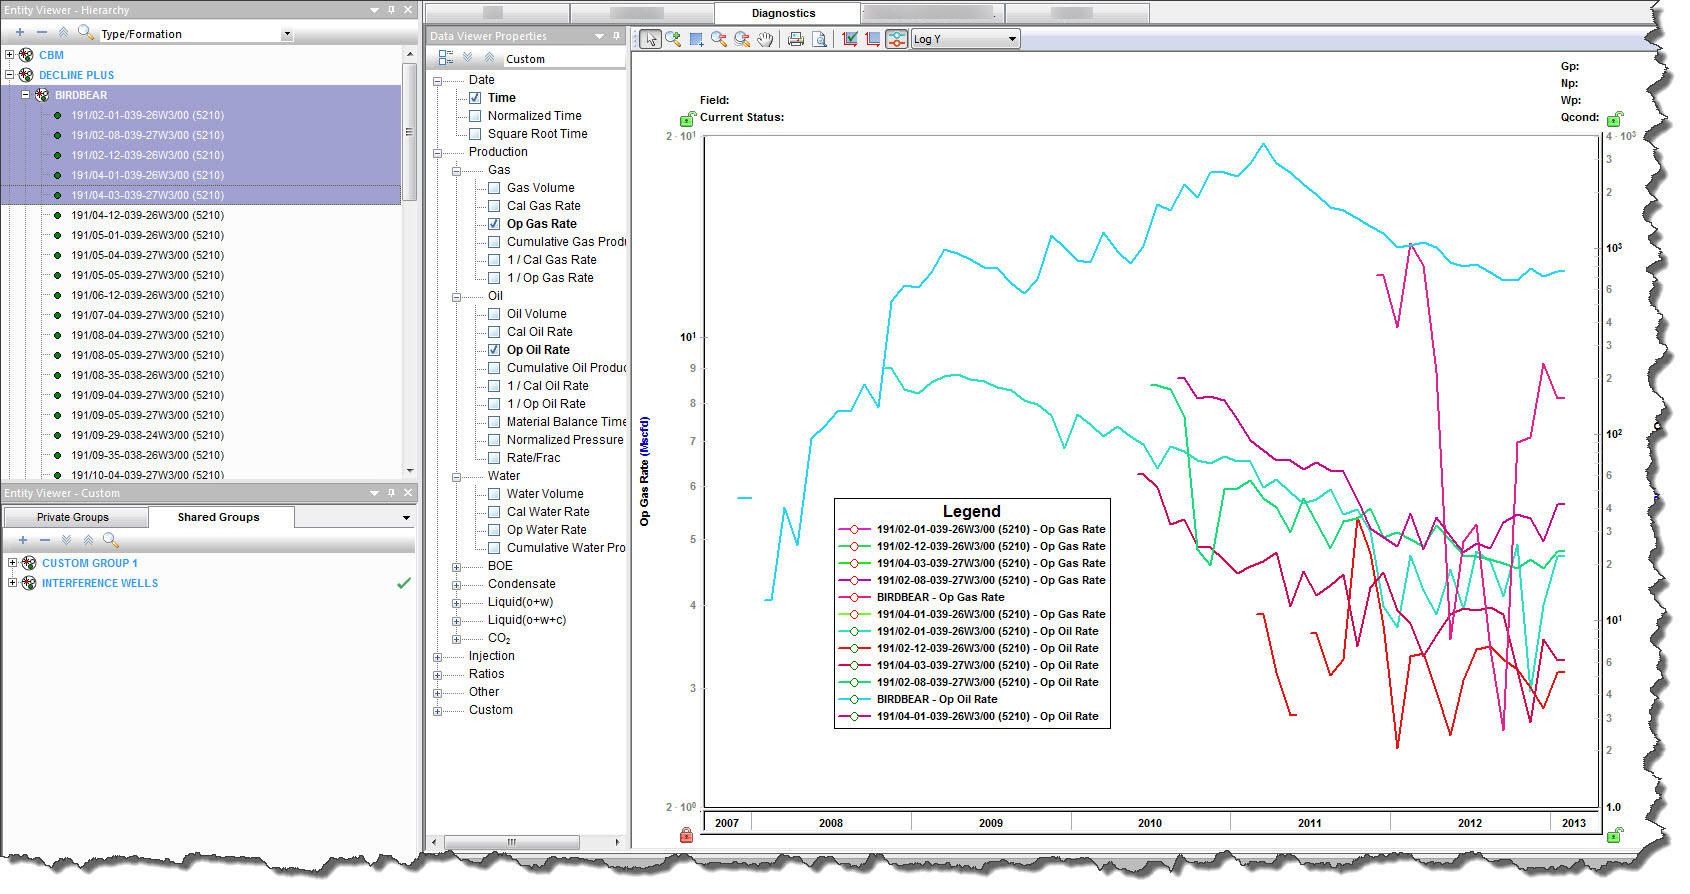
1. Select the wells and/or groups in the Entity Viewer (Hierarchy or Custom).
2. Click the Diagnostics tab.
By default, the auto template selects the gas, oil, and water-rate datasets, if they are populated, and plots them.
3. Select the datasets you want to view in the Data Viewer Properties tree structure by clicking the checkboxes next to the dataset.

Note: Selecting a group displays the aggregate production data of the constituent wells in the group, while selecting multiple wells displays the production data of the individual wells.