Uptime Forecasting
Uptime forecasting is used to apply a user-input percentage or uptime factor to an existing operated-rate forecast to calculate the calendar-rate forecast. As a prerequisite, you must have an existing forecast, and you can only apply the uptime factor against rate vs. time (RT) or rate vs. cumulative (RC) forecasts.
This forecast works with your Harmony Forecast™ license.
Interacting with Uptime Forecasting
For Uptime forecasting the Plot types are Rate Time, Rate Cum, Cum Time declines. Likewise, you can add Ratio trend analyses to evaluate uptime forecasting when linked to an Op Rate Decline.
No Duong and Stretched Exponential Decline Analyses are supported with uptime forecasting.
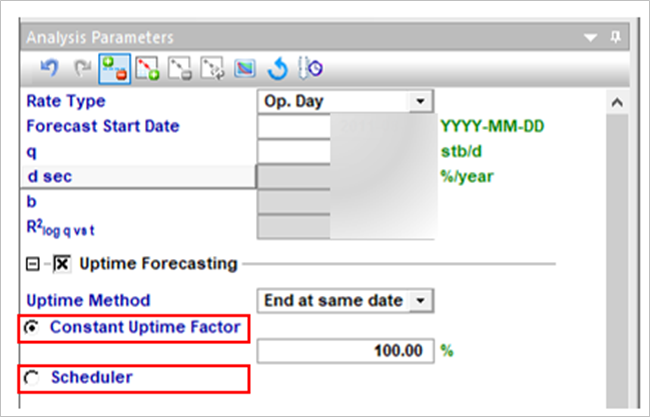
When the check box for uptime forecasting is selected, you will have available two (2) options: a Constant Uptime factor and a Scheduler. The Constant Uptime factor generates a decline analysis multiplying by the uptime factor percentage. Meanwhile, the Scheduler is a tool where the user applies a time specific uptime factor to ranges of dates based on seasonal changes, scheduled shut-ins, flush scenarios, etc.
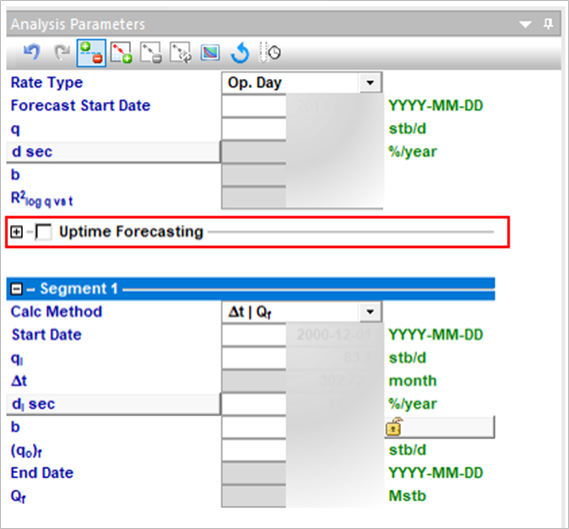
After you create/open your decline forecast, navigate to the Analysis Parameters pane and then enable the Uptime Forecasting using the collapsible option.
Uptime Method
There are two (2) calculations methods available as follow from the dropdown list:
– Constant Uptime Factor
-
Two (2) Calculation Methods:
-
End Same Date
-
End Same EUR
| Note: | When the user selects Uptime Forecasting, the default method is ‘End at same date’. |
– Scheduler
-
One Calculation Method ONLY
-
End Same Date
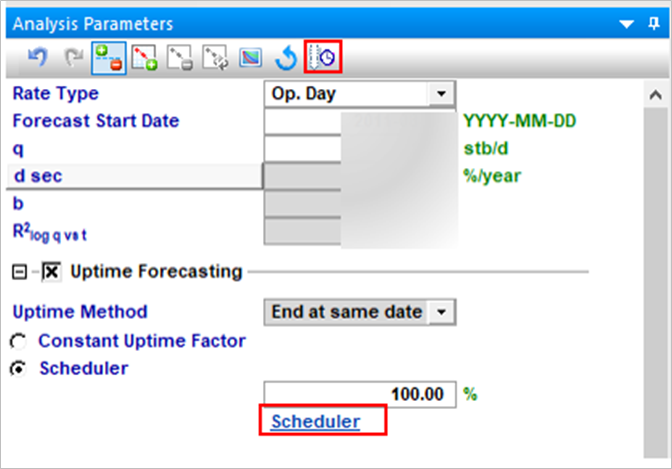
To enable the scheduler, select the Scheduler option. You can also display the Scheduler table by clicking on the link ‘Scheduler’ or on the icon (![]() ) located in the Analysis Parameters toolbar. The icon is disabled if Uptime Forecasting is not selected.
) located in the Analysis Parameters toolbar. The icon is disabled if Uptime Forecasting is not selected.
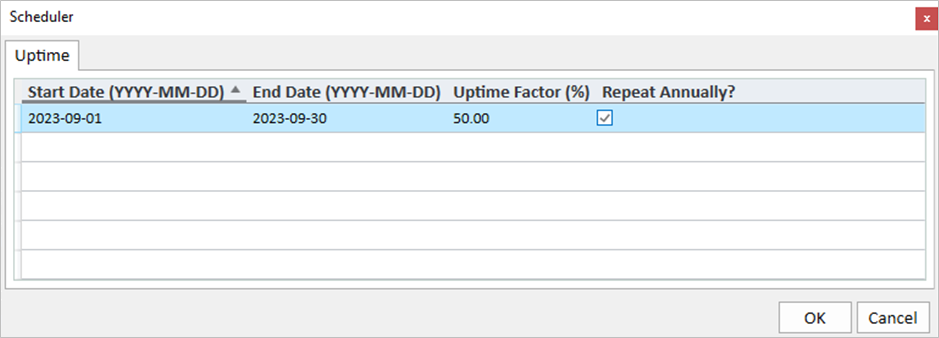
When you select the Scheduler option, you will have a table for adding Start and End Date, Uptime factor % and converting an existing single event into a recurring event.
If an Uptime factor is not specified in the scheduler table, then it defaults to uptime factor % specified outside of scheduler.
If you are converting an existing single event into a recurring event, you must set the Start and End Date and you must click on ‘Repeat Annually?’ check box which generates an event to repeat on the same month and day each year.
The recurrent event is yearly pattern which causes an event to repeat the same month and day each year up to end of your forecast. Repetition is not allowed if the schedule is longer than a year, for example range 2023-03-01 to 2024-04-15.
Plots
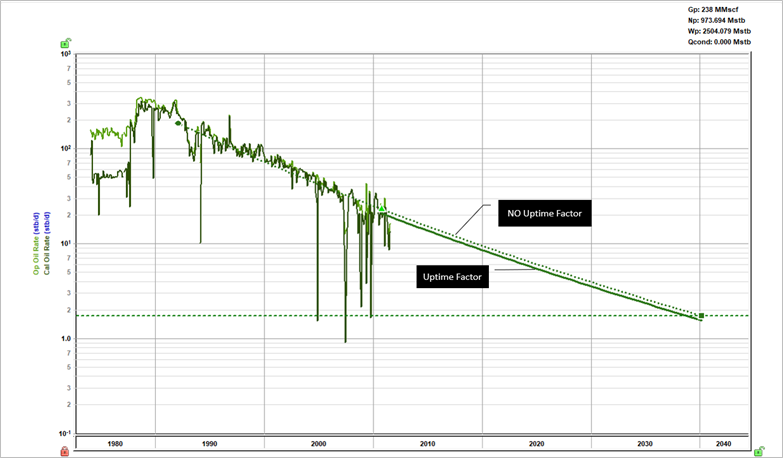
If an uptime factor is applied to your forecast, a secondary line will be plotted. Your original decline analysis will change from solid to dotted, making the uptime forecasting line the solid line. Uptime forecasting line is plotted from Forecast Start Date (FSD) to End Point.
The uptime forecasting is supported by Monitor and Economics.
Options dialog box
You can set the default value for your uptime factor. Please see Options dialog box for more details.