With the gas custom table, you can import inflows (deliverability curves) into Harmony Enterprise that have been generated elsewhere.
Type your reservoir pressure and temperature, then select your fit type:
- Forchheimer — is a commonly used inflow performance relationship (IPR) correlation for gas wells. It requires a minimum of two input points in the custom table to create an inflow curve.
- Linear — is a straight-line interpolation between test points. However, it does not extrapolate to beyond the highest rate entered. It requires a minimum of one input point in the custom table to create an inflow curve.
The Custom Table uses pseudo-pressure for all Forchheimer calculations.
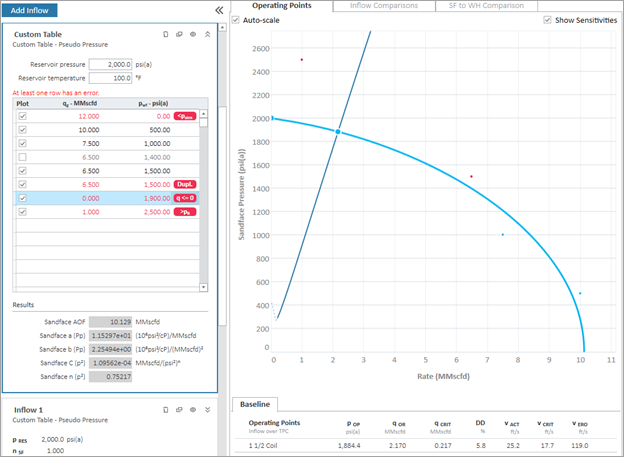
The Custom Table uses your input test points consisting of a stabilized production rate and a sandface flowing pressure, and it uses all valid input points selected in the Plot column. If the Plot checkbox is deselected for an input point, that point is omitted from inflow calculations, and is not displayed on the plot.
If you have an error in the Custom Table, an error indicator is displayed along with a tooltip. Examples of error messages are as follows:
- q <= 0 — the production rate must be greater than zero.
- >pR — the sandface pressure must be less than the reservoir pressure.
- <patm — the sandface pressure must be greater than average atmospheric pressure (14.7 psia or 101.3 kPaa).
- Dupl. — if two data points exist that use the same oil rate, then the Custom Table only uses the point with the higher sandface pressure for inflow calculations, so long as this higher point does not trigger any other error messages.
Imported IPRs (from Advanced Forecast)
From Advanced Forecast, you can push an IPR to an IPR / TPC worksheet.
After a curve is pushed from the Advanced Forecast worksheet, it becomes a read-only analysis in the IPR / TPC worksheet. There is no synchronization between the imported forecast and the source Advanced Forecast analysis.
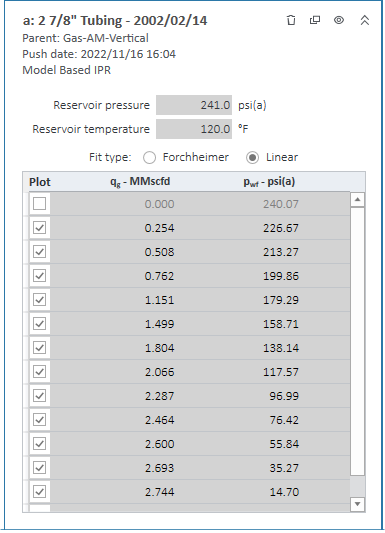
The analysis name is set to "<Forecast Name> | <Forecast Date>" and is read-only. Below the analysis name are two sub-headers: the first is the name of the parent model; the second is the push date. This date is the date and time at which the inflow curve was sent from the Advanced Forecast worksheet. This is a means of version control in case changes have been made to the Advanced Forecast or the parent analytical (or numerical) model.
The custom table is populated with a read-only array of rates and flowing pressures corresponding to the IPR from the Advanced Forecast. All data points are pulled across, with any invalid points being deselected.
If you want to edit the IPR, click the Copy icon (![]() ) to create an editable copy.
) to create an editable copy.
Imported TPCs (from Advanced Forecast)
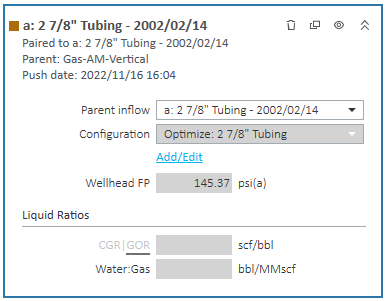
A pushed TPC is similar to that of a pushed IPR. The analysis name is set to “<Forecast Name> | <Forecast Date> | Outflow”. This read-only pane includes additional information regarding the parent analytical or numerical model and push date.
The Parent Inflow selection remains editable so you can pair your pushed Outflow to any Inflow analysis panes on the same worksheet.
The wellbore configuration selection, flowing pressure, and wellbore dimensions are read-only and reflective of the wellbore conditions at the specified forecast step.
If secondary fluid ratios are specified in the Advanced Forecast, these are reflected in the Liquid Ratios section at the bottom of the Outflow pane.
If you want to edit the TPC, click the Copy icon (![]() ) to create an editable copy.
) to create an editable copy.