Inter-well connectivity
The inter-well connectivity analysis helps identify wells which are interacting with a common drainage area and similar deliverability parameters. This analysis is based on that posed by Kabir et al (doi.org/10.1016/j.petsci.2022.09.037) which posits that when plotting the reciprocal-productivity index (RPI) vs. the total-material-balance time, wells in the same compartment beyond the start of the boundary-dominated flow (BDF) period will exhibit a common slope.
A benefit to this method is the simplicity of inputs. The only required inputs for this multi-well analysis are production rates and sandface flowing pressures for each well. An assumption of initial reservoir pressure is also required.
This worksheet has these buttons in the lower left: Patterns and Settings. If you do not see all these buttons, click >> and select Show All Buttons.
Patterns
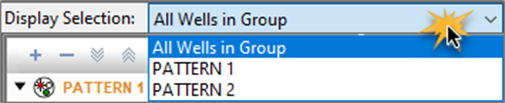
When you create a new worksheet, all wells are listed in the Unassigned category. Patterns are used to group wells that exhibit the same slope on the RPI vs tmb plot. These patterns can be created by selecting wells in the list or in the map view.
Creating patterns
To create a new pattern in the Patterns pane:
-
Select wells in the Unassigned category. Pressing the Shift and Ctrl keys on the keyboard selects multiple wells.
-
Click the Add Entity icon (
 ) and select Create Pattern from selected.
Or, right-click on one of the selected wells and select Move Selected Items, then select (New Pattern).
To create a new pattern on the map view:
-
Select wells on the map by clicking the Area Select (
 ) icon or Lasso Select (
 ) icon.
-
Click the Create Pattern button in the map toolbar.
Modifying patterns
To modify a pattern:
-
Right-click in the Pattern pane.
-
Select one of the following options:
-
Rename Pattern — changes the display name of the pattern in the left pane and on the map. A unique name must be used.
-
Edit Pattern Color — changes the display color of the pattern in the left pane and on the map.
Patterns can be deleted by selecting the pattern and clicking the Remove Selected Entities (
 ) icon.
 -
Settings
As of 2024.1, the sole input in the Settings section is the Initial Pressure input. This value is used when calculating the RPI for each well’s production data.
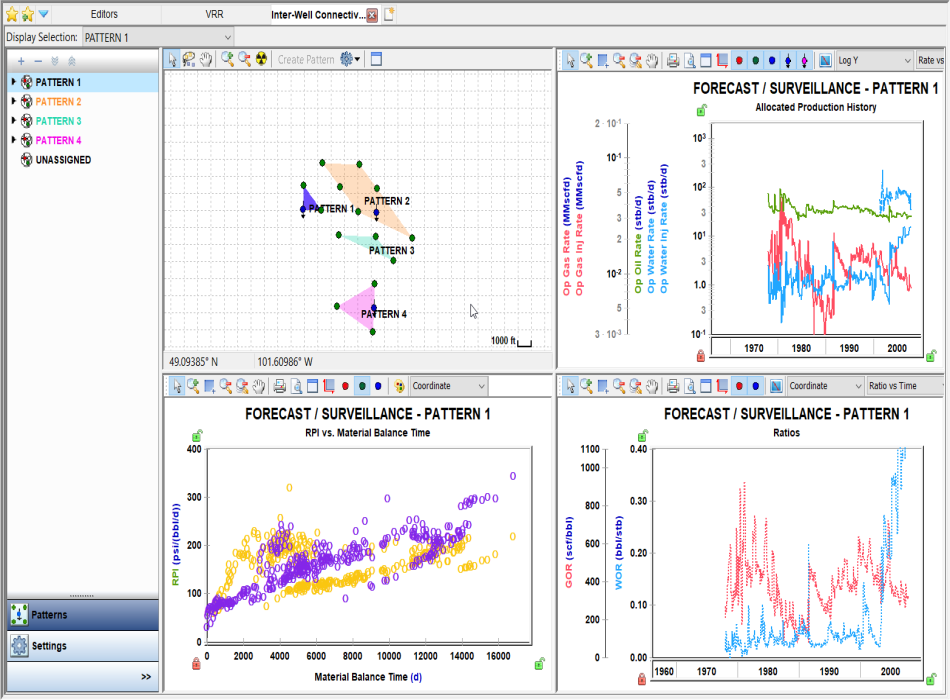
Dashboard
In the dashboard, there are four plots.
The RPI vs Material Balance Time, Production History, and Ratios plots can display datasets for all wells in the selected group, or for a certain pattern based on the selection in the following drop-down list:
For a description of common plot icons, see plot toolbars.
Map view
The map view displays all wells in the group and all created patterns.
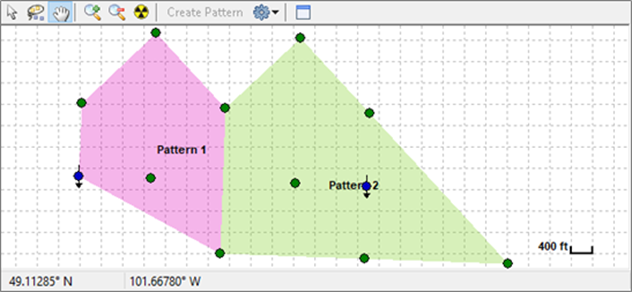
Toolbar icons are as follows:
-
 Create Pattern- creates a pattern from the selected wells.
 -
 Display Settings- clicking this icon displays a drop-down list with the following options: Wells, Well Names, Well Head, Grid, Scale, Patterns, Pattern Names, and Show All.
RPI vs Material Balance Time plot
This plot displays the reciprocal productivity index (RPI) for each well vs the total material balance time for all wells in the selected pattern or group.
This data is calculated as follows:
 for any well at time t
 for all wells at time.
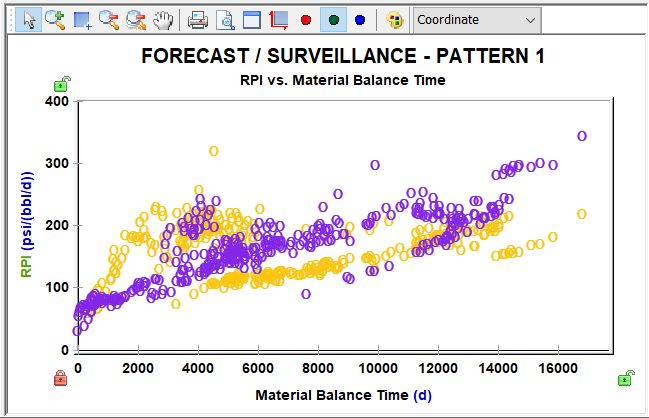
All data is phase-specific, and the displayed phase is denoted by the letter used when plotting the datapoints (‘O’ for oil, ‘G’ for gas, ‘W’ for water). Each individual well has its own unique color on the plot.
Production History plot
This plot displays historical production rates for the selected pattern.
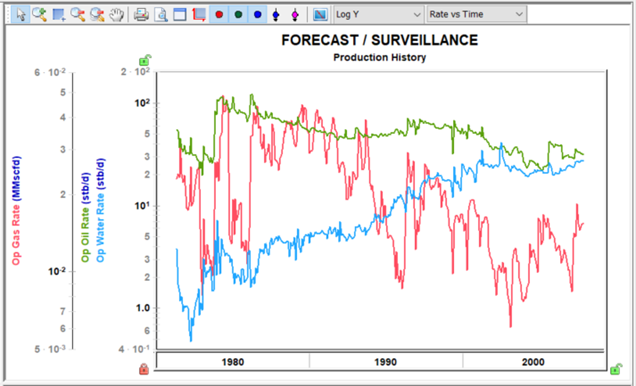
The Well Symbol icons (![]() ) are used to show or hide individual datasets on the plot.
) are used to show or hide individual datasets on the plot.
Ratios plot
This plot displays historical ratios for the selected pattern.
The Well Symbol icons (![]() ) are used to show or hide individual datasets on the plot.
) are used to show or hide individual datasets on the plot.