Based on the selected wellbore configuration, you can calculate and plot the pressure drop and other parameters as gradients in the wellbore. With this information, you can mitigate liquid loading, erosion, and hydrate formation by changing the wellbore configuration or operating conditions. You can also decide upon the best wellbore configuration for a well based on the flow rates.
This analysis works with your Harmony Optimize™ license.
-
 Delete — removes the currently selected inflow, outflow, gradient, or forecast.
 -
 Copy — creates a duplicate of the currently selected inflow, outflow, gradient, or forecast. The name is appended with the word "Copy".
 -
 /
/  Show / Hide — toggle between showing or hiding the inflow, outflow, gradient, or forecast.
 -
 /
/  Collapse / Expand — closes / opens the details for the inflow, outflow, gradient, or forecast. If you see a red triangle (
 ) in the top left of a collapsed analysis, you need to investigate the required parameters.
The analysis includes the following functionality:
- Add Flowing Gradient button — click this button to calculate the pressure drop in a wellbore in the Gradient box. Toggle between Producing and Injecting mode. Circular alerts in the Gradient section notify you of risk factors with the selected gradient [erosion (E), hydrates (H), liquid loading (LL)].
- Pressure header — displays a plot of flowing pressure gradients along the wellbore.
- Hydrates header — displays a plot of temperature and pressure gradients along the wellbore, as well as regions where hydrates may form. If this header has a red dot beside it, this indicates that your data may require further analysis.
- Velocity header — displays a plot of fluid velocity gradients along the wellbore, as well as regions affected by liquid loading or erosion.
- Details header — displays a comprehensive data table. Click the options in Parameters you want displayed.
Pressure header
In this section, you can view pressure gradients.
For the currently selected gradient, pressure is plotted versus depth. If there are multiple gradients, then the active gradient is displayed in blue and other gradients in gray. When you hover over a gradient, its name is displayed.
Injection calculations use the same correlations as production calculations. While this is fine for single-phase flow, it may be a problem for multiphase flow because the correlations may not have been designed for downwards flow.
Hydrates header
In this section, you can view your risk factors for hydrates forming.
For the currently selected gradient, pressure and temperature are plotted versus depth. Regions affected by the formation of hydrates are shaded in light blue, and the pressure and temperature are dotted lines.
Propane content — accepts values between 0-10% propane content by weight.
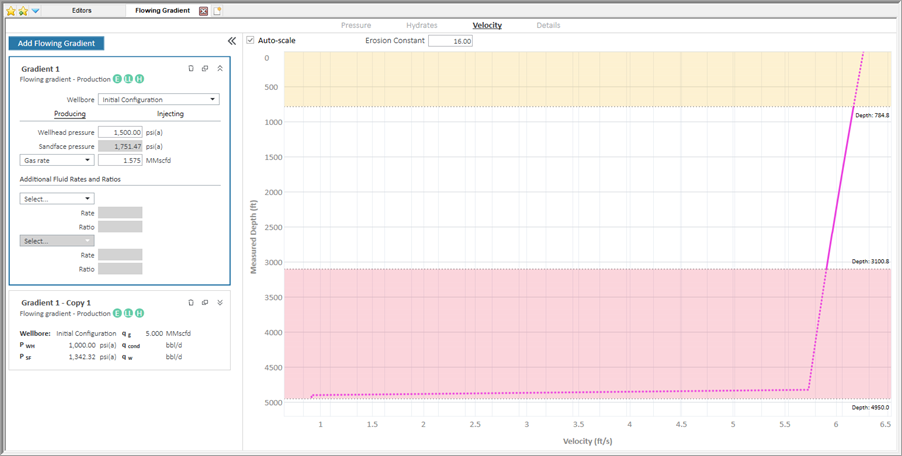
Velocity header
In this section, you can determine the optimal fluid velocity for your wellbore.
For the currently selected gradient, velocity is plotted versus depth. The solid pink line displays the average fluid velocity at any point along your wellbore. Sometimes you may see shading on the plot:
- the pale yellow shaded region denotes the portions of your wellbore where the fluid velocity is above the erosional velocity threshold.
- the pink shaded region denotes the portion of your wellbore where the fluid velocity is below the liquid loading threshold.
Erosion Constant — sensitize your reservoir’s erosional performance through careful adjustment of this constant.
Details header
With this comprehensive table, you can do a deep-dive into the hidden flow parameters for your wellbore. Fluid compositions, PVT properties, pressure losses, and more are available at a segment-by-segment level.
This table is extremely useful for troubleshooting nuanced analyses and the interaction of fluids within the wellbore.
Supported flow paths
This analysis supports most (but not all) of the flow paths available in the Wellbore editor.
Natural flow
The tubing, casing, annulus and both flow paths are supported for single-layer wellbores.
Multilayer wellbores are not supported.
Artificial lift
Flowing gradient supports both Gas Lift and Pumping for Optimize Configurations only.
Gas lift
You can manipulate your production rates and pressures along with your injection rate and pressure to calculate your effective sandface flowing pressure and operating valve. You can generate sensitivities on potential operating conditions in pursuit of maintaining injection through the deepest available valve.
In the screenshot below, a Gas Lift flowing gradient is displayed on the plot. The blue producing-side gradient curve is displayed alongside the red injecting-side gradient curve. Both curves display valve icons at the depths specified in the Optimize wellbore configuration, though only one valve can be considered the operating valve. For more details on each gradient curve’s flow parameters, view the Details sub-tab.

Since gas lift is a method that combines both injection and production, then only the "Producing" option is available (the "Injecting" button is grayed-out). However, the Details tab has additional functionality so that you can show the calculation parameters for either the tubing or annular part of the wellbore.
Pumping
To calculate the flow conditions along your wellbore, type a production rate and a flowing pressure – wellhead, pump intake, or sandface.
The Flowing Gradient worksheet implicitly accounts for total pressure drop across the pump assembly as a whole as miniscule wellbore segments. This worksheet does not calculate per-stage pressure changes.
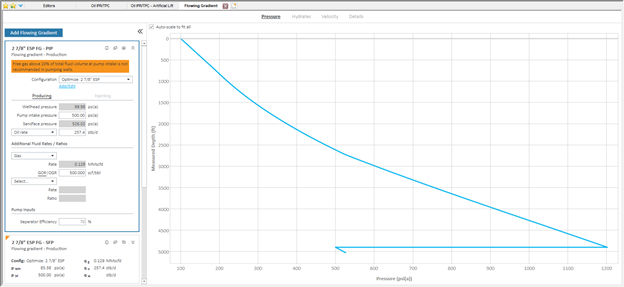
As it is common design practice for ESPs to shunt excess free gas through the annulus, we have added a Separator Efficiency input to model this mechanism.
We have added separator efficiency to modify GOR sent through the tubing. The separator efficiency reflects the percentage of free gas at pump conditions removed from the pump flow path (and produced up the annulus). We are doing a direct calculation – the GOR input is assumed to be seen at the pressure reference point provided. If a wellhead (tubing head) pressure is provided, this is the GOR observed flowing through the tubing. If a Pump Intake or Sandface Pressure is provided, this is the total GOR for the well.
If over 20% of the total fluid volume is free gas at pump intake conditions, ESPs can be damaged. Calculations continue, but a warning message is displayed.
In the screenshot below, the wellbore’s pump decreases the sandface pressure by about 700 psi. A free-gas warning is displayed on the analysis card stating that the free gas volume fraction at the pump intake exceeds 20%. To alleviate this, you can reduce the GOR or increase the separator efficiency.
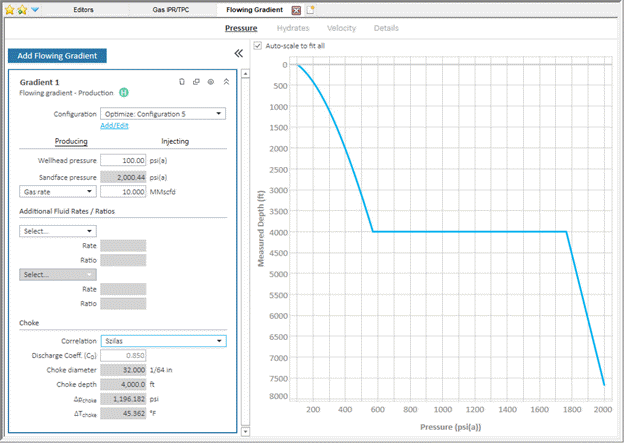
Choke calculations
After selecting an Optimize Configuration with a choke selected, the analysis card displays a choke subsection. This displays the parameters that were set in the wellbore editor, along with pressure and temperature change across the choke.