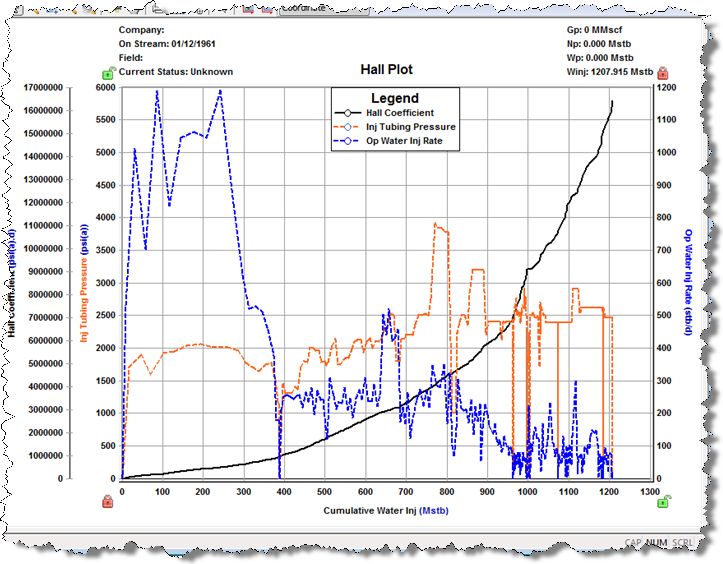
The slope of a Hall plot indicates an individual well's average injectivity. At normal conditions, the plot is a straight line; deviations indicate changes in injection conditions. For more information, see Hall plot theory.
By default, the Hall Plot worksheet displays the Hall Coefficient on the left y-axis and Cumulative Water Injected on the x-axis.
 Click to show / hide an example screenshot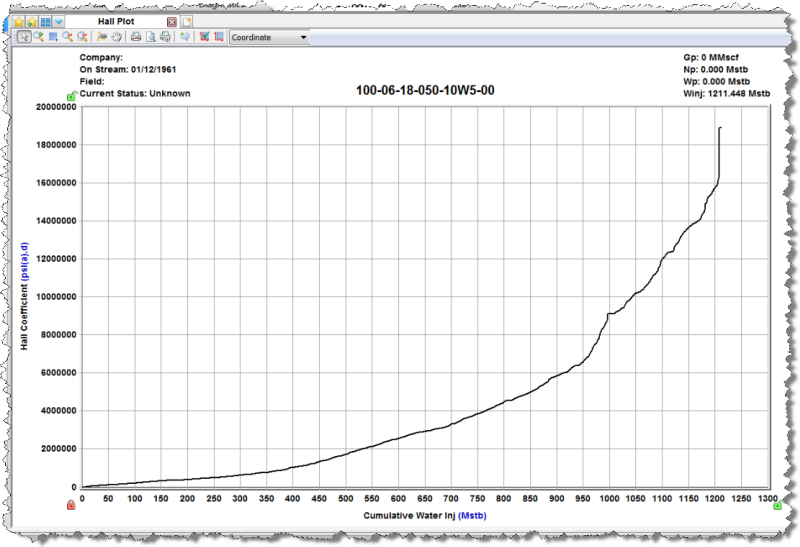
To display other datasets in the plot (for example, Injection Tubing Pressure and Operated Water Injection Rate), click the Plot Selection tab and then click the datasets you want displayed.