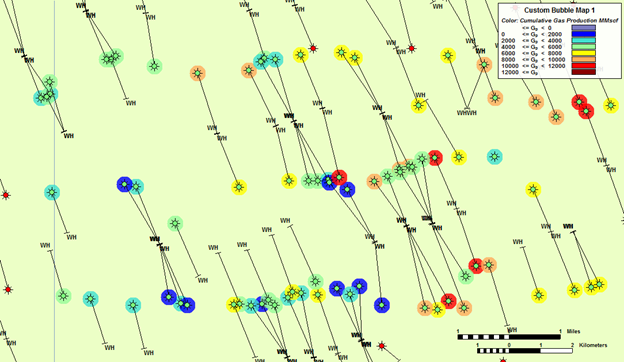
Bubble maps provide a means of graphically representing attributes and analyses associated with specific wells.
Bubble maps are represented as layers within the GIS tab, and can be selectively enabled or disabled like other layers. To create these graphic representations, a colored shape is overlaid on the entity. Both the color and the shape reflect one of the properties associated with the entity. As the value of the property changes, the color changes within a set range. In more complicated cases, multiple properties can be associated with different settings including variations in color, size, angle, and shape, according to the scale you set.
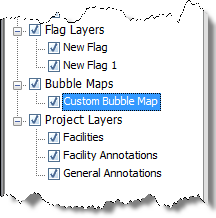
To show or hide the bubble map, select or deselect it in the tree structure.
To add / create a bubble map, start by selecting wells for the bubble map. In the GIS Configuration pane, click the + icon and select Add Bubble Map Layer.

Type a name for your bubble map layer and click Next. If you create a bubble map with the same name, a number is incrementally added to the name (for example, custom bubble map 1, custom bubble map 2, and so on).
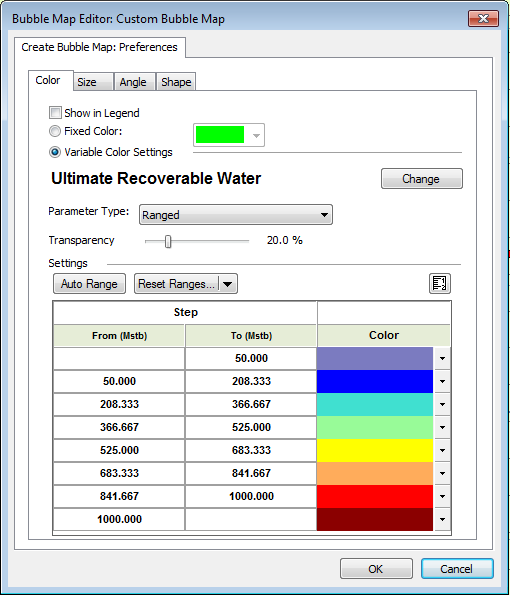
Each tab in Preferences enables you to customize a different property that varies with well properties. (Fixed settings are used by default.)

- Show in Legend — select whether this property is displayed in the legend. If the property is using a variable color setting, by default, the property is displayed in the legend.
- Fixed Color / Size / Angle / Shape — all wells show the same property, as set in the dialog box.
- Variable Color / Size / Angle / Shape — select an attribute or analysis result on which to vary the property. When selecting analysis results, an analysis name must also be selected.
- Parameter Type:
- Ranged — the color, size, etc. displayed corresponds to a range of property values for each parameter.
- Set Point — the color, size, etc. displayed corresponds to a specific value for each parameter.
- Transparency — use the slider to set the level of transparency / opacity for your bubbles.
- Auto Range — for each ranged property, Harmony Enterprise automatically detects the appropriate range and division to separate values.
- Reset Ranges — reverts back to a previously saved range, or to the default values.
- Change — when you click this button, the <Color> Attribute: Select a Property dialog box opens.
- Select the attribute / result from the tree structure.
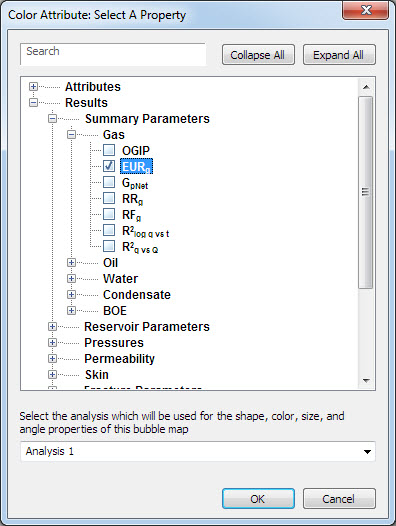
- Search field — type your search term to find attributes or analysis results.
- Analysis drop-down list — select the analysis to populate values for the selected property. Note that this only applies to the Results tree structure, and does not apply to attributes.
To edit an existing bubble map, right-click it in the tree structure and select Options. If you click Variable Color Settings, the Change button is enabled and you can set the <color> for a specific attribute.
To add wells to an existing bubble map, select the well, right-click it and select Bubble Map, Add to <bubble map name>.