 Click to see subtopics:
This topic describes the correlations for the Properties editor.
There are three types of gas correlations: pressure volume temperature (PVT), viscosity, and gas type.
B.W.R. (Table): The Benedict-Webb-Rubin is an empirical relationship that predicts the state of liquids and gases. Tables were developed for approximately fifty substances, mostly hydrocarbons that related gas density, formation volume factor, and temperature to pressure.
B.W.R. (8-constant): The Benedict-Webb-Rubin (8-constant) equation of state developed a set of generalized coefficients in order to permit widespread application to all types of gases.
B.W.R. (11-constant): The Benedict-Webb-Rubin (11-constant) equation of state is a further refined method to predict the state of liquids and gases. Used for all types of gases, it uses 11 empirical constants to achieve a more accurate interpolation of the data.
AGA8 Detail: Calculates the Z-factor based on the physical chemistry of the gas components at specified temperatures and pressures. It can be used when the exact composition (fraction mole percents) of the gas is available.
Carbon Dioxide: The Carbon Dioxide tables are for computing the Z factor for 100% CO2 content.
Nitrogen: The Nitrogen tables are for computing the Z factor for 100% N2 content.
Hydrogen Sulfide: The Hydrogen Sulfide tables are for computing the Z factor for 100% H2S content.
Custom Table: Allows you to enter laboratory measurements for the gas Z-factor or formation volume factor. The Z factor is calculated from the formation volume factor or vice versa. Gas compressibility is subsequently calculated from these two values.
Carr et al: Developed to predict the viscosity of gas hydrocarbon mixtures for temperatures between 32ºF and 400ºF and pressures up to 12,000 psi. Applies to both sweet and sour gas and is designed to handle non-hydrocarbon components (CO2, H2S, N2) in concentrations of up to 15% each.
Lee, Gonzalez, Eakin: Applies to sweet gas and does not account for the presence of non-hydrocarbon components. Applicable for pressure ranges of 100 - 8,000 psi and temperatures between 100ºF - 340ºF. Less accurate for gases with specific gravity above 1.0.
Optimized Lee et al: Developed using the Lee, Gonzalez, and Eakin method, but uses a optimized temperature history to achieve more accurate results, thus resulting in different coefficients in the equations. Less than 5% difference in extreme cases from original correlations.
Lucas et al: Uses the method of corresponding states to calculate gas viscosity. Better suited for higher density gases at lower pressures.
Custom Table: Choosing this correlation allows you to enter custom gas viscosity values from laboratory measurements.
Selecting wet or dry gas changes the results obtained from gas correlations, as different coefficients have been developed for these gas types. The Liquid-rich Gas option allows for the recombination of gas and condensate into a single gas stream. For more information, see reservoir fluid types.
Oil condensate PVT correlations are described below.
Vasquez and Beggs: Developed from data obtained from fields all over the world and generally applicable for all oil types. Covers a wide range of pressures, temperatures, and oil properties.
Al-Marhoun: Developed for Saudi Arabian oils. Valid for all types of gas-oil mixtures ranging from 14 - 45 ºAmerican Petroleum Institute (API) gravity.
De Ghetto et al: Developed for heavy oils (10 < °API < 22.3) and extra-heavy oils (°API < 10) from the Mediterranean Basin, Africa, and the Persian Gulf. Requires separator pressure and temperature.
Glaso: Developed for North Sea oils and it is suitable for oil mixtures ranging from 22-48 ºAPI. Valid for all types of oil and gas mixtures after correcting for non-hydrocarbons in the surface gases and the paraffinicity of the oil.
Hanafy et al: Developed for Egyptian oils gathered from the Gulf of Suez, Western Desert, and Sinai regions. Independent of oil gravity and reservoir temperature. Although authors claim that the correlations are applicable to a wide range of crude oils ranging from heavy to volatile oils (14.3 – 47 ºAPI), it appears to be more applicable for light oils.
Petrosky and Farshad: Developed for Gulf of Mexico oils gathered from offshore regions in Texas and Louisiana. Applicable for oil mixtures ranging from 16 - 45 ºAPI. Provides improved results for the Gulf of Mexico oils compared to Standing, Vasquez and Beggs, Glaso, and Al-Marhoun correlations.
Standing: Developed for California oils. Applicable for oil mixtures ranging from 16 - 64 ºAPI.
Velarde et al: Developed for black oils, applicable for oil mixtures ranging from 12 - 55 ºAPI.
Constant Properties: Allows you to enter values for oil compressibility, the solution gas-oil ratio, and the oil formation volume factor at initial reservoir conditions.
Custom Table: Allows you to enter laboratory measurements for oil compressibility, the solution gas-oil ratio, and the oil formation volume factor.
Beggs and Robinson: Developed from data obtained from fields all over the world and generally applicable for all oil types. Covers a wide range of pressures, temperatures, and oil properties.
De Ghetto et al: Developed for heavy oils (10 < °API < 22.3) and extra-heavy oils (°API < 10) from the Mediterranean Basin, Africa, and the Persian Gulf. Requires separator pressure and temperature.
Hanafy et al: Developed for Egyptian oils gathered from the Gulf of Suez, Western Desert, and Sinai regions. Independent of oil gravity and reservoir temperature. Although the authors claim that the correlations are applicable to a wide range of crude oils ranging from heavy to volatile oils (14.3 – 47 ºAPI), it appears to be more applicable for light oils.
Khan et al: Developed using oil samples collected from Saudi Arabian reservoirs. Gives more accurate predictions for Saudi Arabian oils, compared to the Beggs and Robinson.
Ng and Egbogah: This correlation contains two methods for calculating dead oil viscosity using a modified Beggs and Robinson viscosity correlation and a correlation that uses the pour-point temperature, which is the lowest temperature at which the oil is observed to flow when cooled. The purpose of introducing the pour-point temperature into the correlation is to reflect the chemical composition of crude oil into the viscosity correlation. To obtain the viscosity for live oils, the dead oil correlations are used with the Beggs and Robinson viscosity correlation. This correlation is applicable for oil mixtures ranging from 5 - 58 ºAPI.
Constant Properties: Allows you to enter the value for oil viscosity at initial reservoir conditions.
Custom Table: Allows you to enter laboratory measurements for oil viscosity.
Meehan: Generally applicable to calculate water properties while accounting for salinity.
Constant Properties: Allows you to enter values for the solution water gas ratio, water formation volume factor, water compressibility, and water viscosity at initial reservoir conditions.
Custom Table: Allows you to enter laboratory measurements for water properties.
There are two types of geomechanical correlations: permeability and compressibility.
Yilmaz and Nur: A generic correlation suitable for extremely low permeability reservoirs.
Dobrynin: A more detailed correlation designed for over-pressurized reservoirs that require porosity as an input. Valid in the pressure range of 0 – 20,000 psi.
Custom Table: Allows you to enter laboratory measurements for the permeability ratio.
Dobrynin: A more detailed correlation designed for over-pressurized reservoirs that require porosity as an input. Valid in the pressure range of 0 – 20,000 psi.
Custom Table: Allows you to enter laboratory measurements for formation compressibility. The formation compressibility ratio is calculated using the formation compressibility entered for each pressure divided by the initial formation compressibility coming from the basic reservoir properties.
Analytical: Developed based on theory and generally applicable for calculating capillary pressures.

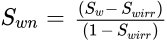

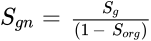
where: a0 = Coefficient 0, a1 = Coefficient 1, ...
Brooks-Corey: An empirical approach to calculate capillary pressures and works satisfactorily in many cases. It requires residual wetting-phase saturation. Uses a lithology factor that allows the correlations to be generalized to any lithology.

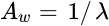


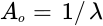
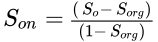
Custom Table: Allows you to enter laboratory measurements for capillary pressure values.
There are two types of relative permeability correlations: 2-phase models and 3-phase models.
Corey: This model assumes the wetting and non-wetting phase relative permeabilities to be independent of the saturations of the other phases, and requires only a single suite of gas / oil relative permeability data.
Honarpour: Developed using data from oil and gas fields in the continental US, Alaska, Canada, Libya, Iran, Argentina, and the United Arab Republic.
Generalized-Corey: Similar to the Corey correlation, but developed for a wider range of rock and wettability characteristics.
Custom Table: Allows you to enter laboratory measurements for 2-phase relative permeability.
Stone 1: Based on the channel flow theory, and it is used widely in the industry as the benchmark for oil simulation. It is a better predictor than Stone 2 in low oil-saturation regions. More appropriate for water-wet systems, and not suited for intermediate wettability.
Stone 2: A modified version of Stone 1. It is a better predictor than Stone 1 in high-oil saturation regions. More appropriate for water wet-systems, and not suited for intermediate wettability.
Baker: Based on saturation-weighted interpolation between the 2-phase relative permeability values. Well suited for intermediate wettabilty or oil-wet systems.
IHS Harmony™ 2016b Multi-User | Last revised: October 19, 2016
Copyright © 2016 IHS Inc.