Forecast plots
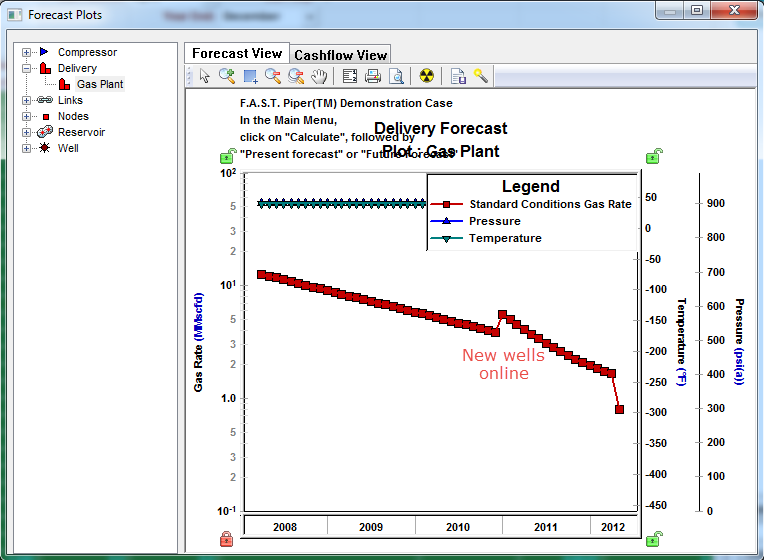
Forecast plots are used to validate the data entered in your model. Forecast plots can be generated for all facilities in your gathering system to display rates and pressures over the forecast duration.
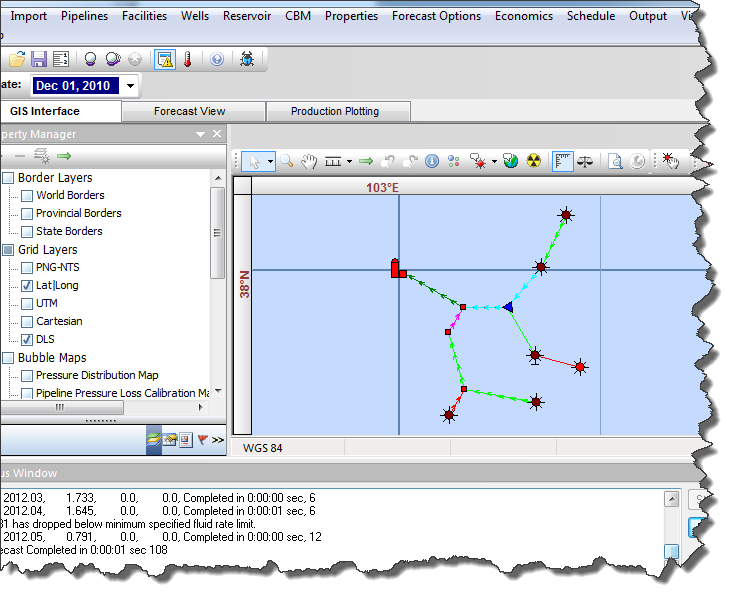
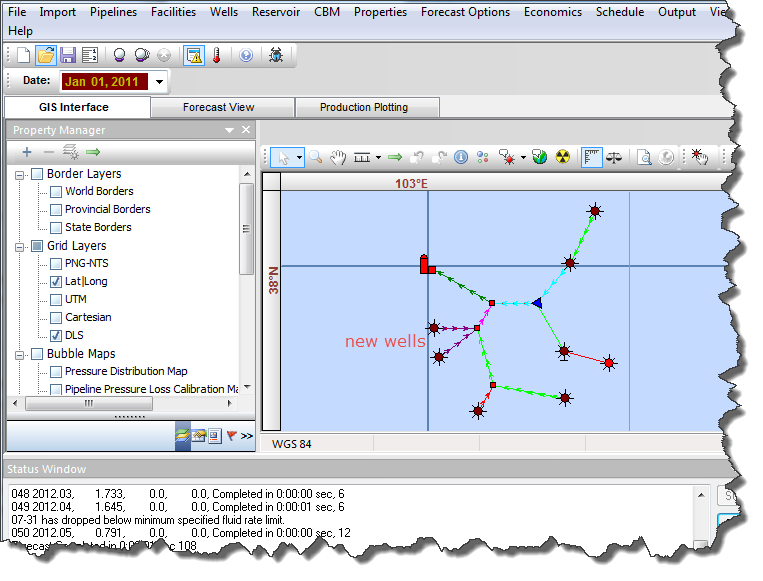
For example, in the screenshots below, the forecast view plot indicates an increase in gas rate in Jan 2011 at the delivery facility. By using the GIS interface and case controller, changes for Jan 2011 confirm that two new wells were brought online resulting in an increase in the gas rate. "Change dates" can also be viewed in the forecast view.
Forecast plots for the other facility types can also be used to quickly identify and confirm the accuracy of rate and or pressure changes throughout the forecast duration.