Diagnostic tools
Diagnostic tools are described below.
Using the map
This screen provides a view of the entire gathering system.
Pipeline IDs can be color-coded and the default settings adjusted, by clicking the selecting Properties menu and selecting Link Colors.:
Click the Show Link Colors option to toggle pipeline colors on and off.
Annotations
Facility annotations
If facility information is needed, annotations are a useful tool. To adjust the display options of facilities in the gathering system map, select the Annotation drop menu in the GIS toolbar.
![]()
Each facility type has various information that can be displayed. The left-side of the Facility Annotations Editor, contains a list of properties specialized for the facility type that can be displayed in the map. The right-side has visual properties for the annotations. By default, all annotations are turned off making it easier to create and modify models. Custom defaults can be saved if you prefer by clicking the Save as Default button.
This dialog box controls all annotations for the specific facility type; it does not affect the other facility types.
During forecasting or traversing through the display dates after a forecast, the annotation values update with every interval of the forecasting period.
To switch between facilities in the Annotation editor, use the drop-down menu.
Custom annotations
Customized annotations can be set for each facility, if specialized annotations are required. To modify the display options of any facility on the gathering system map, place the cursor over the facility and right-click. You are prompted with one of the following drop menus:
Follow the facility menu to the Annotations options and select the Edit option.
The annotation editor that appears now is specifically for that facility. The name of the facility will appear where the facility type was.
Warning: Each node (no matter what facility type it is) can hold one custom annotation. Creating a custom annotation will overwrite old annotation settings in all other configuration dates. This means that if there was a facility change in a different configuration date, the annotations will display only the custom annotation settings even when the facility types are different. Trying to edit the custom annotations again will only show the new custom settings in the other facility type.
The Apply to All button will apply the current settings to all facilities of the same group. For example, annotation settings for Well 1 will be applied to all well type facilities. Apply to All will also overwrite all custom annotations and reset all annotation positions.
There is an alternative method to restore the annotations to the other configuration dates if clearing the other custom settings or resetting the positions is not an option. Simply return to the date that custom annotation was made for. Change the annotation to the same settings as the default settings for that facility type. The facility's annotation will no longer be considered as a custom setting and the annotations will be return to defaults in the other configuration dates.
General annotations
General annotations are used for displaying any other notes or labels anywhere on the map. By default, General Annotations are disabled. Enable them through the Property Manager to display the General Annotations.
To use, right-click the map and select General Annotations then Create to add an annotation or Edit the to modify an existing annotation.
On the left of the General Annotations Editor is where the user can
input any text. It has basic font functions such as size, style, bold
and underline. Symbols can also be entered using the buttons ![]() and
and ![]() to express equations.
to express equations.
The right of the editor much like the Facility Annotation Editor, deals with the visual settings and positioning of the annotation.
The name of the annotation can be edited directly in the drop box.
Note: Default options are currently disabled for future enhancements.
Additional annotations can be created in this editor by using the ![]() or removed using the
or removed using the ![]() .
.
Coordinate of where the mouse was clicked will be automatically used as the anchor location. If the Anchor to Location is not used, the annotation will be defaulted to the upper left corner of the map. Also, an annotation not anchored does not move with the map like a regular Facility Annotation. It will always stay in the users screen when zooming or panning.
The Draw Settings affect how the annotation will look on the map.
Annotations can be used further enhance the visual presentation of the model.
More display options
You can select the parameters you want displayed in the gathering system map for any facility. The example shown above is for well display options. The user can also choose the position of the display around the facility, as shown on the right hand side of the window.
The size of text and symbols on the map screen can be adjusted by selecting Customize, which is found under the Properties menu:
Well naming in Merak / Dwight files
Production history can be imported from a Merak (.mer) and Dwight (.dp2) file.
Well naming
For Merak files:
- Well Names will be defined to be the Well ID (record 0001 in the merak file)
- Alias Names will be defined to be the Well Name (record 0002 in the merak file)
Note that the Well ID is used for the Well Name because it insures there is always a unique name.
For Dwight files:
- Well Names will be defined to be the following: "PRODID" from the REC1RCI record + " - " + "APINO" from the REC1ENG record
- Alias Names will be defined to be the following: LEASENAM" from the REC1RCI record + " " + "WELLNO" from the first RECWHDR record + "/" + "the last four digits of the "PRODID" from the REC1RCI record
Note that the combination PRODID and APINO is used for the Well Name because it insures there is always a unique name.
Other diagnostic tools
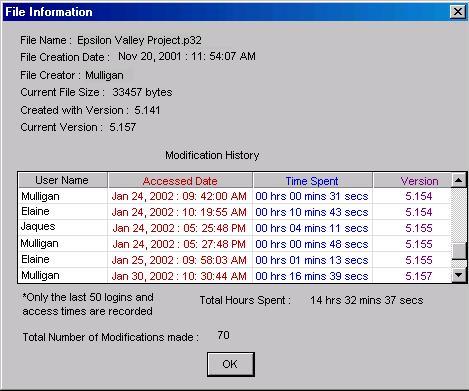
File information
You can access File Information under the Help menu. It provides the following information about the active file: name, date the file was created, date the file was last modified, version of the software that generated the file and current version.
Link color legend
The Link Colors legend can be added by right mouse clicking on the map and selecting the following.