Derivative Analyses
Subtopics:
Derivative analyses are used to identify all flow regimes present in pressure transient data and to estimate values for parameters (e.g., k and s') that can be determined by the analysis of each of these flow regimes. Diagnostic analysis lines are matched to various regions of the derivative response, and various parameters are calculated based on the analysis type and line position.
Due to the fact that the derivative is often noisy and that information can be lost from over smoothing, it is recommended that the standard analyses are also used to fine-tune the parameter values obtained from the derivative analysis.
Introduction
By definition, the derivative is the slope (m) of the data when plotted on semi-log coordinates (see radial flow analysis) as follows:

There are several numerical techniques available to calculate a derivative. Two methods, standard and Bourdet, are available within the software and are described below. Both methods incorporate a smoothing algorithm to reduce noise in the derivative. Be aware that smoothing should be used with caution, since over smoothing the derivative can completely change the shape, and mask or show flow regimes that may not exist. Therefore, it is recommended that a minimum amount of smoothing be applied, so that results are in a recognizable shape of the derivative curve.
Standard Derivative
The standard definition of the semi-log derivative is as follows:

This definition assumes two points along the semi-log data curve are used. By applying a least squares fitting technique, this definition can be expanded to allow for more than two points (up to the total number of data points) to be used to calculate the derivative.
Bourdet Derivative
The Bourdet derivative is an alternative way to calculate and smooth the derivative based on a log-cycle fraction. To calculate the Bourdet derivative at any given point, one point before and one point after that point is used. Using these points, the Bourdet derivative is defined as follows:

Where the variables are defined in the following diagram:
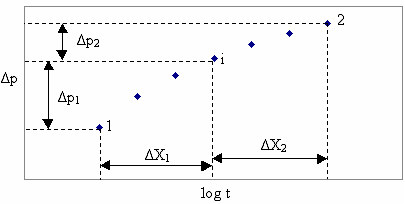
Using this definition, DX represents the log-cycle fraction used to control the amount of smoothing. Note this value is typically quite small (0.01 to 0.2) and a small increase represents a significant increase in smoothing.
References
1. "Derivative Analysis Without Type Curves", Louis Mattar, JCPT Special Edition (1999) vol. 38.
2. "Use of Pressure Derivative in Well-Test Interpretation", D. Bourdet, J.A. Ayoub, and Y.M. Pirard, SPE Formation Evaluation, (June 1989).