Forecasting in Advanced Models
Subtopic:
With forecasting, you can estimate reservoir gas, oil, or water production rates or pressures using an analytical solution based on your specified reservoir properties and forecasting parameters. Forecasting in advanced models takes the production history into account, and does not commence assuming static reservoir conditions.
The forecasting and test design module within advanced analytical models can also be used without production history, to investigate the potential deliverability of a new reservoir given the uncertainties of reservoir flow capacity and volumetric parameters. It can also be used to investigate which flow regimes would be investigated during a test for a specified set of reservoir properties, flow, and shut-in periods.
To create a forecast:
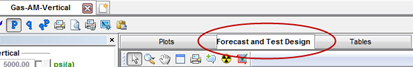
1. After creating an Advanced Model, click the Forecast and Test Design sub-tab.
2. Select your forecast time method in the Forecast Options section.
3. In the Duration column of the forecast table, enter a value for the length of the forecast.
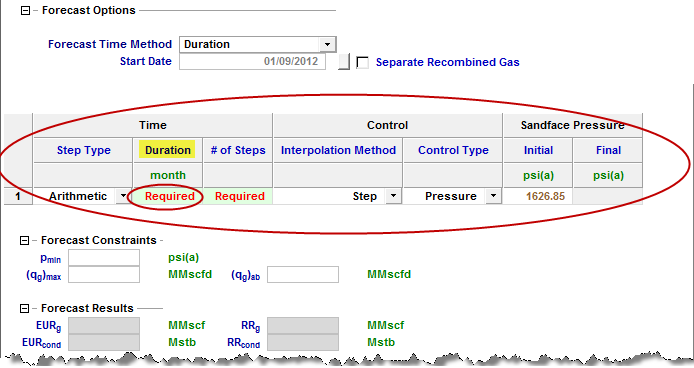
After a duration is entered, the # of Steps column automatically equals the duration in months; however, this value can be edited.
Note: The default minimum number of steps is 10.
Changing the number of steps may change the calculated expected ultimate recovery as cumulative production is dependent on the length of each timestep. Flowing pressure for the forecast is automatically populated to the last historical value; however, this value can also be edited.
4. (Optional) After a value is entered in the forecast table, an additional row is displayed where a second forecast period can be entered. This row does not have to be populated for a forecast to run. Rows can also be added or deleted by right-clicking a row and selecting Insert / Delete row.
Forecasted data is displayed on the Results plot. This data consists of a fluid rate, forecasted pressure, and the average reservoir pressure. If more than one forecast case is present, the results of each are displayed on the Results plot.
5. View the results of your forecast, displayed as a plot, in the Forecast Results section.
Forecasting Injection
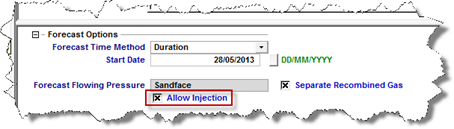
Running forecasts or test designs is similar for injection and production wells. However, for injection wells:
- the Allow Injection checkbox must be selected:
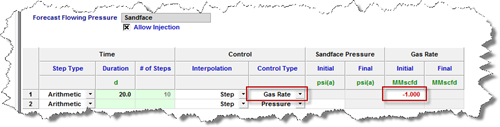
- injection rates are denoted using negative values:
| Note: | Wellhead forecasting is not yet available for injection. Therefore, the Forecast Flowing Pressure field is grayed-out if the Allow Injection checkbox is selected. |