Identifying Closure
Related Topics:
G-Function Analysis
Square Root Time Analysis
The closure point is identified on the G-Function and Square Root Time plots.
1. On the G-Function plot, rotate the Fracture Closure line through the straight-line portion of the Semilog Derivative data by clicking the line and dragging it.
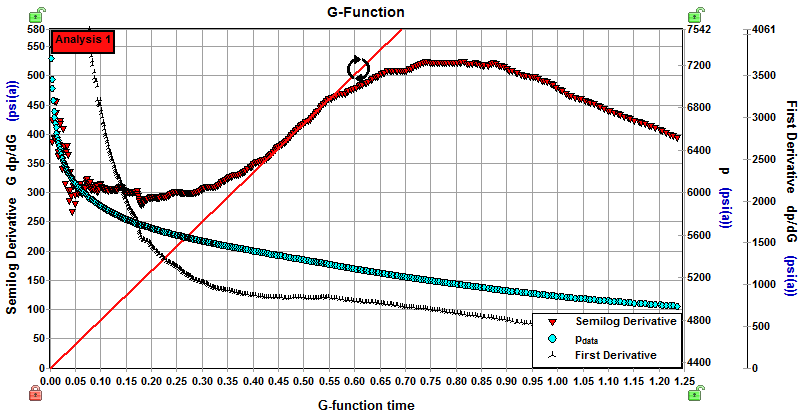
2. Click the closure arrow icon on the G-Function plot toolbar and select the synchronized arrows.
![]()
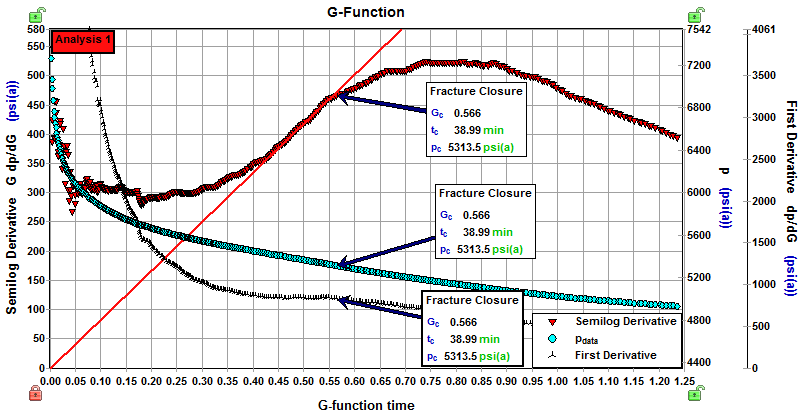
3. Click the G-Function plot where the Semilog Derivative data starts to deviate downward from the straight line to add the closure arrow annotation.
4. Click the closure arrow and use the left and right arrow keys to fine-tune your selection.
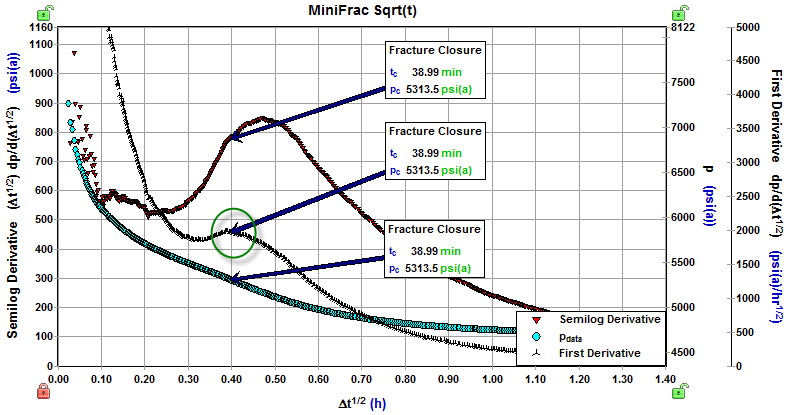
5. On the MiniFrac Square Root Time plot, the closure point should correspond to the peak of the First Derivative. You may move the synchronized arrow to fine-tune your selection.