Smoothing Data
The goal of smoothing is to make the data smooth enough for us to analyze (e.g., identify flow regimes on a derivative plot) without distorting the general trend of the data. Datasets contained within any gauge can be smoothed in the Smooth tab located above the gauge tables.
| Note: | Prior to using this function, you must import data. |
To smooth data:
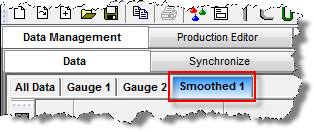
1. Click the Data Management tab; then click the Smooth sub-tab.
2. If you have two or more gauges, the Select Gauge / Dataset dialog box opens. Select a gauge; then click OK.
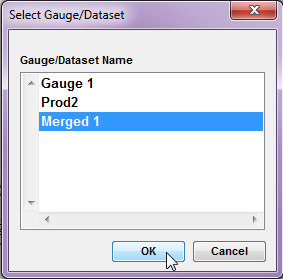
The data is displayed on the Smoothing Plot.
Gauges with rate and pressure data are automatically partitioned into flow and shut-in periods. You can merge pressures and rates prior to smoothing. Alternatively, you can manually partition your data by clicking in the partition area at the top of the Smoothing Plot. Drag a partition marker to move it, or drag it off the plot to remove it.
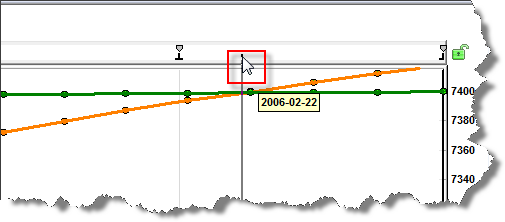
3. On the Smoothing Plot, click the dataset and region you would like to smooth. This activates the smoothing sliders, located above the Smoothing Plot.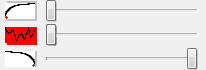
4. Click-and-drag the middle slider to the right to smooth more, or to the left to smooth less. The slider bars on the top and bottom control the degree to which smoothing is tapered off on the left and right ends of the selected region.
You can zoom into the region (e.g., flow or shut-in period) you are smoothing. 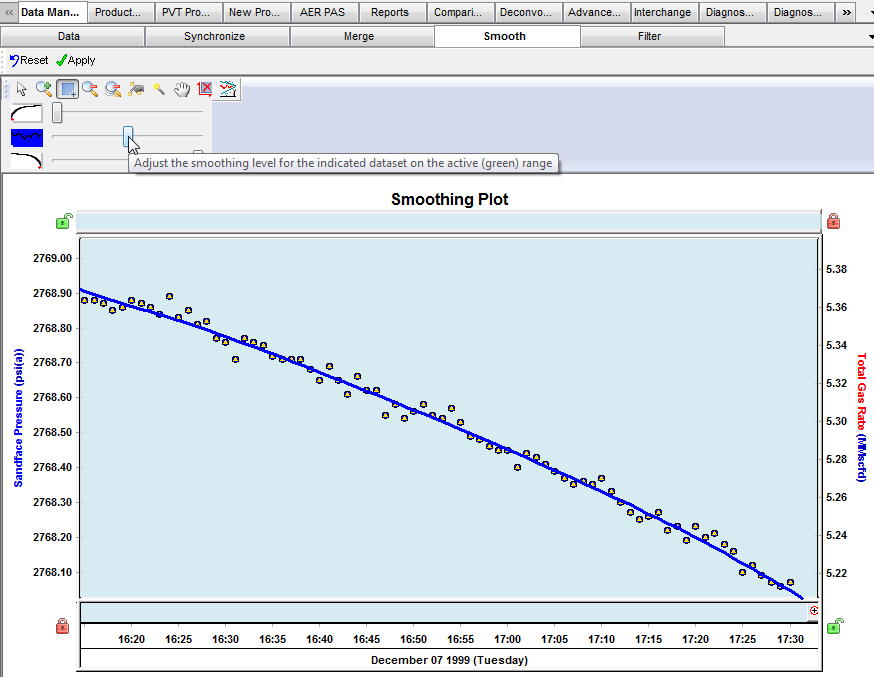
5. Repeat steps 3 and 4 for all datasets and regions you would like to smooth.
6. Click Apply.
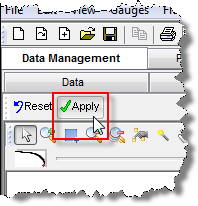
A new gauge, called Smoothed 1, is created inside the Data sub-tab.