Minifrac Observations From Real Data
Observations made from minifrac tests conducted in various shale / tight formations in North America have provided some insight on what to expect. Not surprisingly, the time required to achieve fracture closure during the falloff period is greatly influenced by the injection rate and injection volume. Minimizing both of these components greatly increases the chance of observing fracture closure in a reasonable time frame, and possibly achieving radial flow to reduce the uncertainty in estimating reservoir pressure and formation permeability.
In many cases, injection rates on the order of 1 to 2 bpm (1440 – 2880 bbl/d) have been observed to quickly achieve formation breakdown. With average injection times of 3 – 5 minutes, fracture closure was observed within 1-to-24 hours of falloff. In some cases, radial flow developed quickly after closure, while in others, bilinear and linear flow was observed. When radial flow developed soon after closure, a falloff period on the order of 1 – 3 days was sufficient to obtain reliable estimates of reservoir pressure and formation permeability.
When bilinear or linear flow is observed after the main closure event, the development of radial flow is delayed, and may not be observed in a reasonable time-frame. Although this introduces greater error in estimating the reservoir pressure and formation permeability, extending the falloff period helps reduce the error. For these situations, the required falloff duration is case sensitive, and depends on the importance of the information. Even if radial flow is not achieved, “upper limits” of reservoir pressure and formation permeability can usually be determined, which are very useful.
An example of a minifrac test analyzed using WellTest is shown in the figures below. The test was conducted on a vertical well at a formation depth of 10,000 ft. Pressures were monitored at the wellhead, and converted to sandface values for analysis. The total test duration was about 24 hours. Figure 1 shows the pressure profile during the 18-minute injection period performed at 1 bpm (1440 bbl/d). The sudden drop in pressure shortly after injection commenced indicates that formation breakdown occurred very quickly.
Figure 1
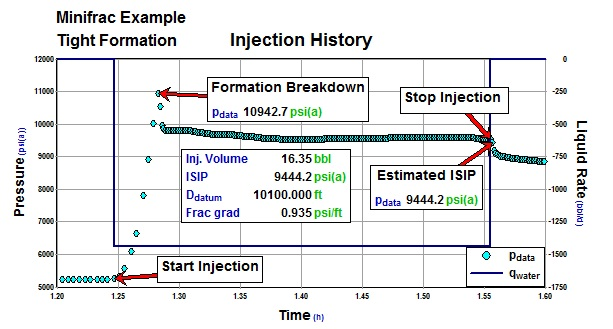
Figure 2 shows the pre-closure analysis using the semi-log and first derivative corresponding to G-function time. From this plot, fracture closure is identified within the initial 3-hours of the falloff period.
Figure 2
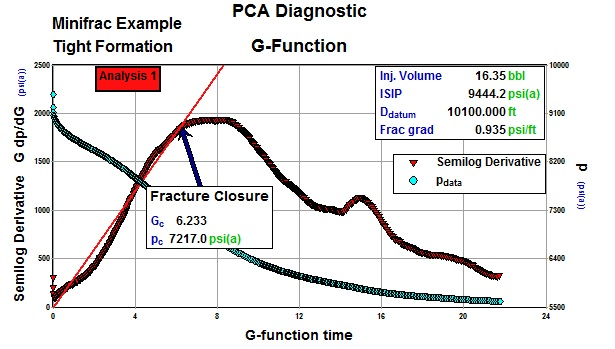
Figure 3 represents the log-log diagnostic plot used mainly for identifying the flow regimes developed “after-closure”. The semi-log derivative, calculated with respect to shut-in time, exhibits a slope of -1 shortly after-closure, suggesting that radial flow has developed. The fluctuations in the derivative slope can be attributed to gas-entry that is not accounted for with the sandface pressure calculations.
Figure 3
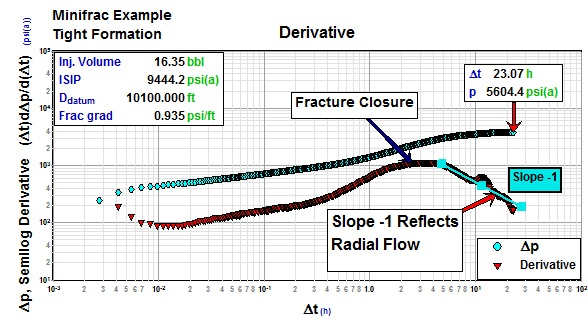
Figure 4 represents the falloff data plotted with the radial time function for the Soliman / Craig solution.
Figure 4
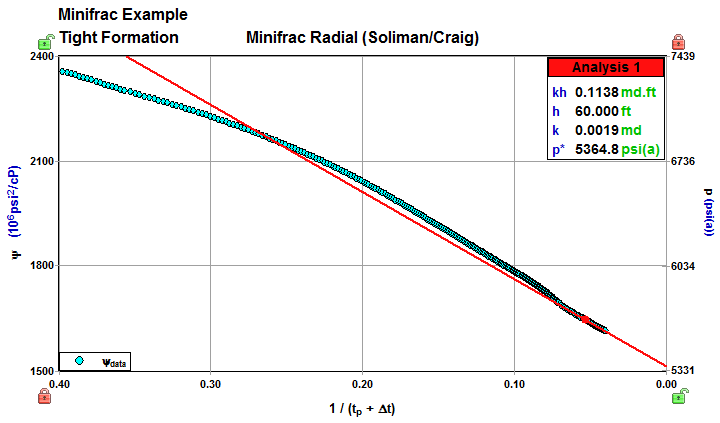
Figure 5 represents the log-log plot of the derivative data and shows the match obtained with the Soliman / Craig model. The model suggests radial flow was not quite achieved during the test period, and would likely develop after about 49 hours of falloff. However, in this case the transition to radial flow is sufficiently developed to yield reliable estimates of formation pressure and permeability.
Figure 5
