Comparison Plot Tab
Plots or datasets from anywhere within WellTest or another Fekete application can be displayed on the Comparison Plot tab. One common use for this is to overlay typecurve responses from different flow / shut-in periods within the same test, or from analog wells.
The easiest way to get data into the comparison plot is to copy-and- paste a plot into the comparison plot.
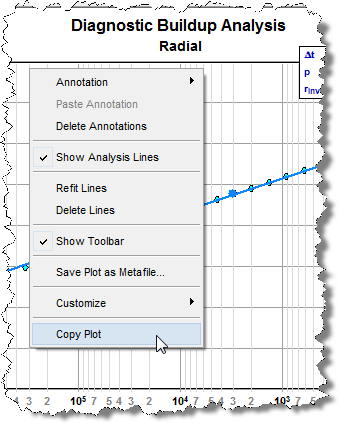
1. Right-click the plot and select Copy Plot.
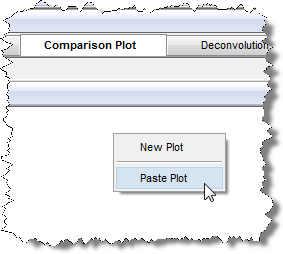
2. Click the Comparison Plot tab; right-click below the tab and select Paste Plot.
Note: The same procedure can be followed to overlay a different plot.
Now the datasets from both plots are displayed on the same comparison plot. If two datasets with the same color and symbol are pasted onto the same plot, the symbols for the second dataset will automatically be changed, so that the curves may be easily distinguished from one another.
3. (Optional) Modifications to dataset names, symbols, and line types can be made by right-clicking the comparison plot and selecting Customize.
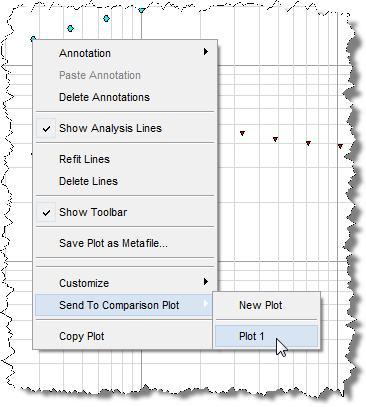
4. (Optional) Individual datasets may also be sent to the comparison plot by right-clicking a data point on any plot and selecting Send to Comparison Plot.