Deconvolution Tab
Subtopics:
The screenshot below shows the standard deconvolution interface. Note that any of the plots can be docked or undocked by double-clicking anywhere in the plot area.
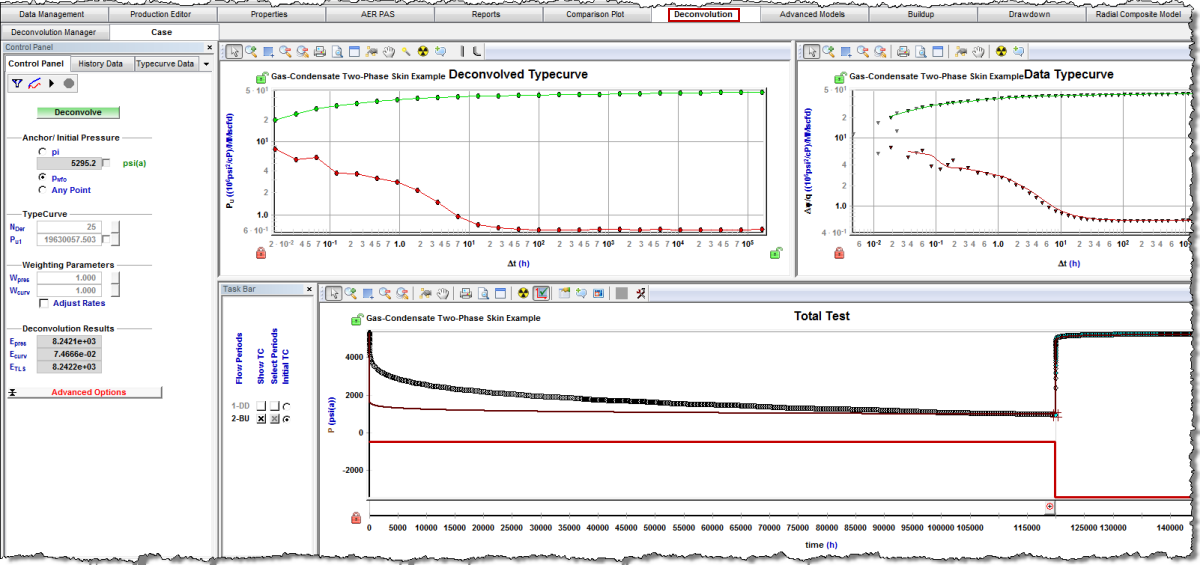
Deconvolution Plots
Deconvolution plots are described below.
Deconvolved Typecurve
This plot displays the deconvolved typecurve (unit rate pressure response) for the reservoir. Note that until the deconvolution is run, this plot only shows the initial typecurve specified in the task bar, and does not show the final result.
Data Typecurve
This plot displays the match between the deconvolved and selected typecurve data. Additional flow periods can be displayed (overlayed) on this plot in one of two ways:
1. By toggling the Show TC checkboxes on the task bar.
2. By right-clicking the Total Test plot over a flow period and selecting Show Typecurve from the popup menu.
Total Test
This plot displays the pressure and rate history. Pressure points can be selected (light blue) or deselected (white) for fitting on this plot.
Task Bar
The task bar provides an easy way of displaying flow periods, selecting points, and selecting the initial TypeCurve (TC). Each row corresponds to either a DrawDown (DD) or a BuildUp (BU) period. The task bar can be docked, undocked, or hidden as needed.
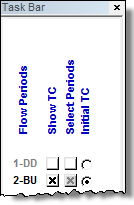
- Show TC — Toggle these checkboxes to show / hide any flow period on the Data Typecurve plot. (TC = Type Curve)
- Select Periods — Toggle these checkboxes to select / deselect any flow period pressure data for fitting.
- Initial TC — Click a radio button to select which flow period typecurve to use as the initial Deconvolved Typecurve. By default, the final buildup is selected. The initial typecurve can also be manually adjusted by clicking-and-dragging any derivative point (red) on the Deconvolved Typecurve plot. Alternatively, you can use the Linear Point Alignment option from the toolbar on the Deconvolved Typecurve plot by clicking a derivative point (red) and drawing a trend line that the derivative points should follow. When the left mouse button is released the derivative points is aligned along this trend line.
| Note: | After any change to the derivative, the Pu curve is updated accordingly. |
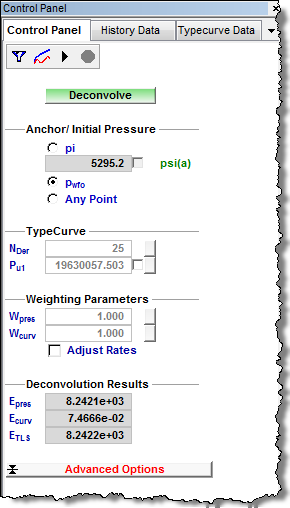
Control Panel
In the Control Panel, you can modify various deconvolution parameters / options and display the fitting results. You can also start and stop the deconvolution fit.
| Note: | For more information on deconvolution parameters and how they affect the fit, see Deconvolution Theory. |
Toolbar
The toolbar icons are as follows (described from left-to-right): ![]()
- Filter The Data — Opens the Filter Well Data dialog box (Data Reduction Module), which is used to filter out noisy / unreliable data.
- Initialize Typecurve — Resets the Deconvolved Typecurve to the selected initial typecurve (Init TC) on the task bar.
- Run Deconvolution — Starts the fitting (deconvolution / minimization) process to determine the Deconvolved Typecurve that best fits the data.
- Stop Deconvolution — Stops the fitting (deconvolution / minimization) process if it is running.
Anchor / Initial Pressure
Click a radio button to select which pressure to anchor to in order to determine the initial pressure (pi) used for fitting. The three options are:
1. pi — Use the specified pi (no anchor); note that the specified pi can be entered in the field, or set by clicking-and-dragging the calculated pressure curve on the Total Test plot up or down. Selecting the checkbox for this parameter includes it during the fitting process. We recommend that when pi is not known, that the other anchoring options be used to minimize instability during the fitting process.
2. pwfo — Anchor to the final flowing pressure before the last buildup is selected; pi is back-calculated so the calculated pressure curve on the Total Test plot matches this point.
3. Any Point — Anchor on any pressure point. After selecting this option, click the pressure point on the Total Test plot to anchor to. The A # symbol is displayed over the pressure point you are anchored to when this option is on. To change the anchor point at a later time, click the anchor icon on the Total Test plot toolbar and click another pressure point.
Typecurve Options
These parameters directly affect the Deconvolved Typecurve, as well as the calculated pressure:
- NDer — Sets the number of points on the Deconvolved Typecurve derivative. Increasing this value adds more resolution to the typecurve, but reduces the calculation performance during fitting.
- Pu1 — Sets the value of the first point of the pu curve on the Deconvolved Typecurve. Selecting the checkbox for this parameter includes it in the fitting process. Note that the fitting process may take longer to run when this parameter is set to auto. We do not recommend fitting on this parameter and pi at the same time, so as to avoid instability in the fitting process.
Weighting Parameters
These parameters can be used to place more emphasis on various error terms to fine-tune the fit. By default, all the weighting factors are set to 1.0 (no weighting).
- Wpres — Sets the weighting factor that the pressure error (Epres) is multiplied by during the fit.
- Wcurv — Sets the weighting factor that the curvature error (Ecurv) is multiplied by during the fit.
- Wrate — Sets the weighting factor that the rate error (Erate) is multiplied by during the fit. Note that this option is only visible when the Adjust Rates option is selected.
- Adjust Rates — Select this checkbox to include rate corrections in the fit. If this checkbox is not selected, the Wrate and Erate parameters are hidden.
Deconvolution Results
These fields display the following calculated errors during the fit.
- Epres — The overall error between the measured and calculated pressures.
- Ecurv — The curvature error. Represents the amount of curvature on the derivative of the Deconvolved Typecurve. The more linear the derivative curve, the smaller this value will be.
- Erate — The overall error between the measured and calculated rates.
- ETLS — The total least squares error, which is a summation of all the errors.
Advanced Options
Clicking the Advanced Options button displays the following options:
- Minimization Method — Sets the method to use for fitting (minimization). The default recommended method is More-Hebdon. Other methods (Line Search and Double Dog Leg) can be used in this order, if the current method fails to find a solution.
- Initialization Method — Sets the method used to initialize the Deconvolved Typecurve. The default method is Use Initial TC, which initializes the typecurve to the flow period specified in the Initial TC column of the task bar. The Radial method initializes the typecurve as pure radial flow (straight line) based on the flow period specified in the Initial TC column of the task bar.
Filtering
Filtering is used to remove noisy and/or unreliable data (e.g., outliers) and reduce the number of points to improve performance when fitting. For these reasons, we recommend filtering the data prior to setting up or running the fit.
There are two ways to filter data:
1. Click the Filter The Data icon on the Control Panel toolbar to open the Filter Well Data dialog box (Data Reduction Module). Modify the filtering options as needed to filter the data accordingly. Any filter settings that are changed are saved and used again in subsequent filter operations.
Note: Each time you use this filter option, all the flow periods (Select Periods column on the task bar) are re-selected in order to include them in the filtering process.
2. Select the Filter Data menu option from the popup menu on the Total Test plot. The filter is applied only to the flow period the mouse hovered over when right-clicking. Note that this filter option does not remove any points from the dataset, but rather deselects the pressure points based on the filter, so they are not included when fitting.