Production Editor Tab
Subtopics:
Related Topics:
Calculating Sandface Pressures
Loading Data into the Production Editor
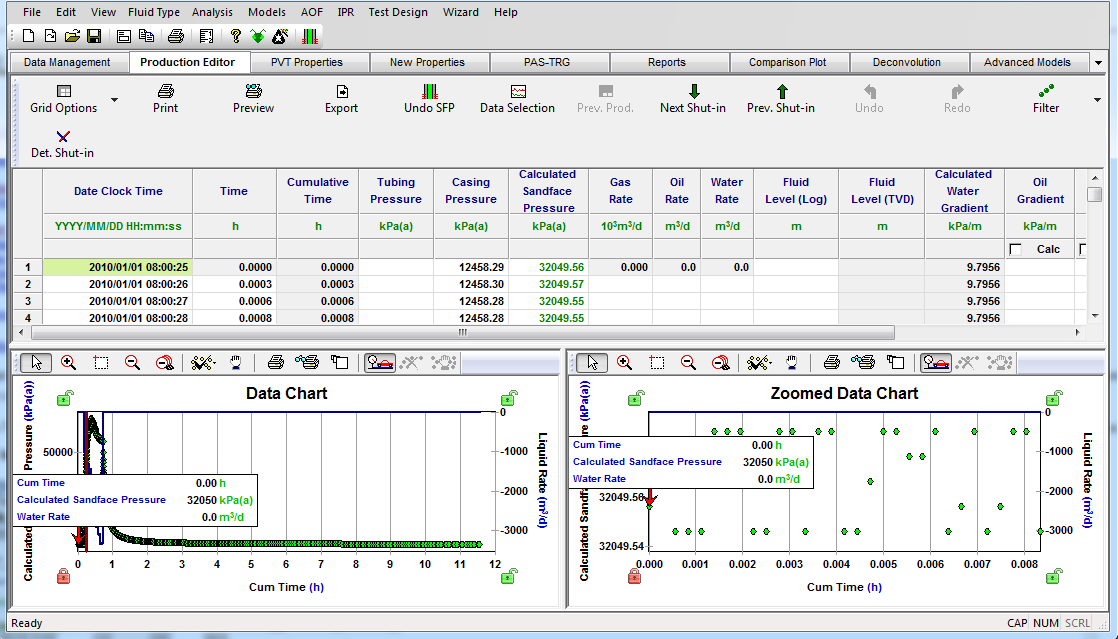
In contrast with the Data Management tab, which houses the raw data, the Production Editor tab contains data for analysis and modeling. As a result, data may be manipulated to ensure there is data consistency, and that pressure data is converted to sandface conditions. The main components of this tab are the Data Table / Grid, the Data Chart, the Zoomed Data Chart, and the Toolbar.
The Data Table / Grid, Data Chart, and Zoomed Data Chart are all linked. If you click a row in the table, the annotation arrow moves to the corresponding point on the data chart. Similarly, if you click a point in the data chart, the corresponding row on the table is highlighted.
| Note: | The data table is also known as a grid, so the Grid Options icon corresponds to the data in the table. |
Data Table / Grid
The data table or grid, contains date / clock time, cumulative time, tubing pressure, casing pressure, gas, oil, water and condensate rate, fluid level, oil and water gradient, and average liquid gradient columns.
Another column is effectively the active pressure column, and the title of this column is either Wellhead Pressure, Measured Sandface Pressure, or Calculated Sandface Pressure depending on the data type. After the data is prepared for analysis, it is the pressure data in this column that is used for analysis.
| Note: | The notation WellTest uses for rate data is "end of period". For additional information, see End of Period - Rate Data. |
The Total Gas Rate column is not editable and is used for analysis of gas wells. This column is for the recombined gas rate for condensate wells, and is equal to the gas rate for wells with no condensate. When the Use RGRF checkbox in the header of the Cond. Rate column is checked, the rates in the Gas Rate column are multiplied by the recombined gas rate factor (RGRF) in the Recombination section of the Properties / Gas Properties tab. This option should be used when the condensate rates aren’t available, or when the produced condensate gas ratio (CGR) is sporadic due to challenges with measurement and reporting. When this option is unchecked, a different recombined gas rate factor is calculated for each row. The inputs to this calculation are the gas and condensate rates, used to obtain a CGR, the separator pressure and temperature, and condensate gravity in the Recombination section of the Gas Properties tab.
The oil and water gradient columns are used for calculating sandface pressures for the hydrostatic head of the fluid below a specified fluid level. These gradients may be calculated using the PVT properties when the Calc checkbox in the header of these columns is selected, or entered manually, when the Calc checkbox is unchecked.
Data Chart
The pressure and rate data is plotted on the Data Chart. To focus on the test data, the Data Chart autoscales to display all the pressures. However, you may wish to customize the scale to view the previous production.
| Note: | To find a shut-in point quickly, right-click the Data Chart within the first few buildup points, and then press the left arrow key to move the arrow annotation back a few points. This is much more efficient than trying to click on the final flow point. This is because the data density is much lower at the start of the buildup because the pressures are changing quickly with time. |
Zoomed Data Chart
The Zoomed Data Chart shows a zoomed view of the data point selected on the Data Chart. It autoscales to show 30 points to the left and right of the selected point.
Toolbar
The following icons are on the WellTest toolbar.
Grid Options
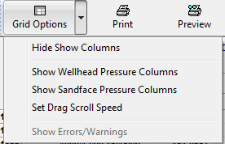
To hide or show different columns on the data table, click the Grid Options icon (![]() ) on the toolbar and select your desired options from the drop-down list:
) on the toolbar and select your desired options from the drop-down list:
 .
.
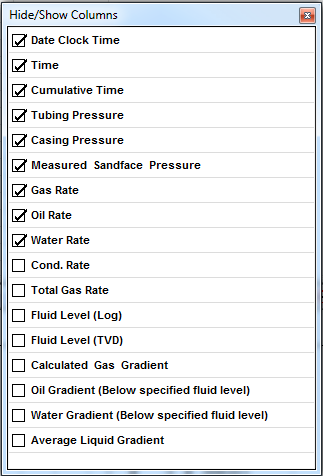
- Hide Show Columns – can also be accessed by right-clicking anywhere on the table and selecting Show Columns. When you select this option, the Hide/Show Columns dialog box opens, where you can click the checkboxes for the columns you want to show (or hide) on the table.
- Show Wellhead Pressure Columns – shows the time, rate, and wellhead pressure columns, as well as the liquid level and gradient columns that are used to calculate sandface pressures.
- Show Sandface Pressure Columns – shows the time, rate, and sandface pressure columns, and hides the wellhead pressure, liquid level, and gradient columns.
- Set Drag Scroll Speed – sets the speed at which the mouse wheel scrolls through the data table / grid.
- Show Errors / Warnings – shows Production Editor errors / warnings, such as time out of sequence errors, if there are any.
Print / Print Preview
Print, or get a print preview of the Production Editor table.
Export
Export the Production Editor table to a .csv file. See Exporting for additional information.
Calc SFP / Undo SFP
Click this icon to calculate sandface pressures (SFP). Note that this icon is only active if there are measured tubing or casing pressures in the Production Editor. If sandface pressures have already been calculated, the name of this icon changes to "Undo SFP".
Data Selection
This icon launches a dialog box where you can select data from the Data Management tab, and bring it into the Production Editor for analysis. Pressures and rates may be brought it from different gauges, and are automatically merged into the Production Editor.
Previous Production
This icon launches the WellTest Wizard: Previous Production dialog box, which prompts you to either enter previous production data manually, or specify an effective producing time. Note that this icon is only available for test types that require rates.
Next Shut-in / Prev Shut-in
To view the shut-in points in your dataset, click the Next Shut-In and Prev. Shut-In icons (![]() ) on the toolbar. Clicking these icons adjusts the locations in the table where you have a change from production or injection to shut-ins (zero rates).
) on the toolbar. Clicking these icons adjusts the locations in the table where you have a change from production or injection to shut-ins (zero rates).
Undo / Redo
These are standard Undo / Redo operations for any changes made to the Production Editor dataset.
Filter
Clicking the Filter icon (![]() ) opens the Filter data dialog box, where you have the option of conducting a primary data filter. The primary data filter is a standard step in preparing data for analysis. For additional information, see Filtering.
) opens the Filter data dialog box, where you have the option of conducting a primary data filter. The primary data filter is a standard step in preparing data for analysis. For additional information, see Filtering.
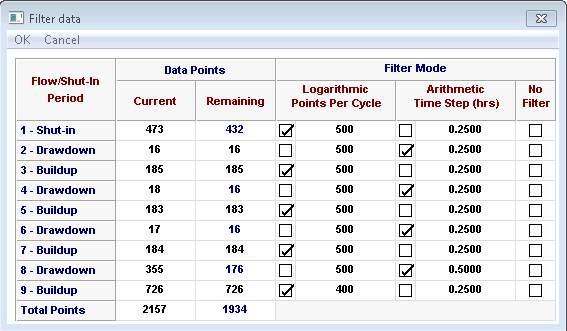
The data is segmented into flow and shut-in periods and different filtering parameters may be applied to each period. It is very important that the flow and shut-in periods have been correctly specified before filtering. With the checkboxes you can select the filter mode (e.g., logarithmic, arithmetic, or no filter) for each period. The values in the Logarithmic Points Per Cycle and Arithmetic Time Step columns are editable. The Current and Remaining Data Points columns keep track of how many points there originally were, and how many points remain after the filter is applied. The final row shows the total number of points before and after filtering.
Logarithmic filtering keeps more data at the start of the flow period, when the pressure is changing a lot with time, and less data at the end, when the change in pressure is more gradual. (This is the default for all shut-in periods.) Arithmetic filtering takes evenly spaced points (e.g., 1 point per hour) and is the default for all flowing (or injecting) periods.
The filtering defaults are very conservative and keep way more data than is necessary. For example, a handful of derivative points could accurately describe the trend within any log cycle, including a transition out of wellbore storage. By default, we keep 500 points per cycle of shut-in data. As a result, most users apply the filter without changing the default filtering parameters.
Determine Shut-in
Clicking this icon opens the Determine Shut-in window where you can insert a time, pressure, and zero-rate point into the middle of your dataset. This is useful when the final flow point is not clearly defined.