Properties Tab
Subtopics:
Additional Properties for Liquid-rich Gas
Relative Permeability Properties
Related Topics:
Gas Properties Reference Material
Oil Properties Reference Material
Water Properties Reference Material
CBM Properties (PDF)
Shale Properties (PDF)
Geomechanical Reservoir Models (PDF)
Capillary Pressure (PDF)
Capillary Pressure Correlations (PDF)
Relative Permeability (PDF)
Relative Permeability Correlations (PDF)
| Note: | All PDFs open in a new window. |
In the Properties tab, you can enter and view reservoir and fluid parameters. Within the tab there is a Property Type View, a Reservoir Properties View, an Inputs Pane, and a Main View.
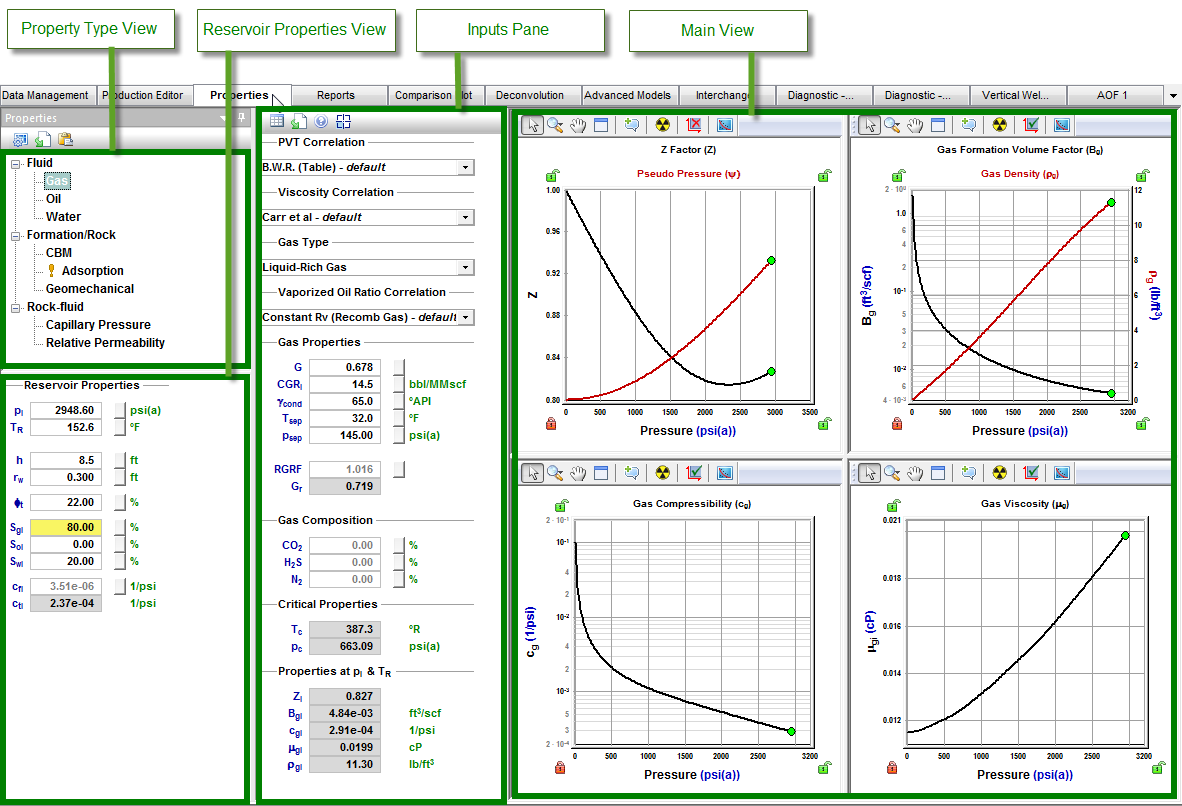
Property Type View
In this view, you can select the property type. When you click to select a property type, the Inputs pane updates to show the available inputs and calculated parameters specific to that property type, and the Main View updates to show the appropriate correlations in plot or tabular format.
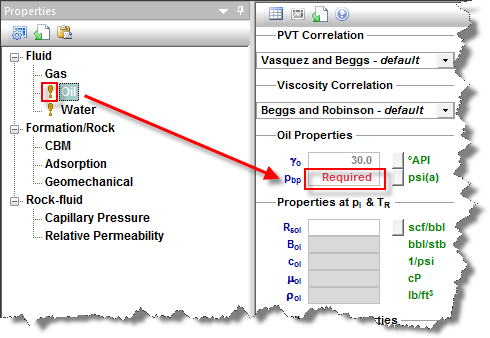
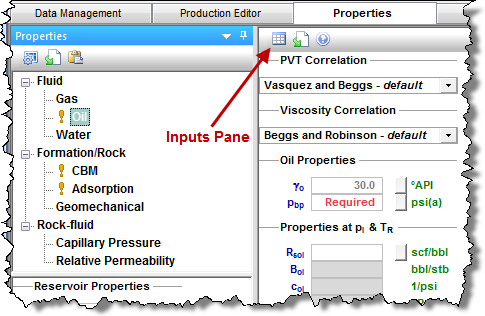
An exclamation mark beside a property type indicates that the properties have not been fully specified. In the screenshot below, Oil has an exclamation mark beside it. This is only a problem if your reservoir has oil. If this is the case, click Oil and enter the required parameters.
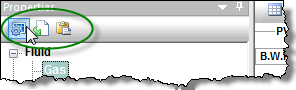
The Property Type view also has a toolbar where you can change your plotting options, import custom data, and copy / paste data.
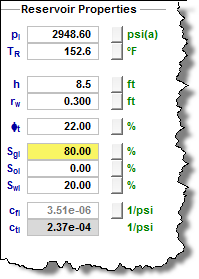
Reservoir Properties View
This view includes inputs for standard reservoir properties. Some of these parameters, such as reservoir temperature, are required in order to display data on the plots or tables in the Main view.
Inputs Pane
The Inputs pane is to the right of the Properties pane. This pane shows the available correlations, input parameters, and calculated values specific to the property type selected in the Property Type view. The inputs can change when the correlation changes.
Toolbar Icons
The toolbar icons for this pane are as follows:
- View Data
 — view your data in the Main view in a table format. This icon is only displayed when the Main view is displaying plots.
 - View Plot
 — view your data in the Main view represented by plots. This icon is only displayed when the Main view is displaying tables.
 - Import Data
 — bring in your custom property data.
 - Help for Correlations
 — after clicking this icon, select either PVT Correlation Help, or Viscosity Correlation Help. A dialog box opens, which displays information about each of the available correlations. This icon is disabled for property types that don't have correlations.
 - Change Bottom Left Plot
 — while viewing your plots, there may be an additional plot that can be viewed by clicking this icon. This icon is only displayed when more than four plots are available. For example, when liquid-rich gas is selected, there is an additional plot to view the vaporized oil ratio.
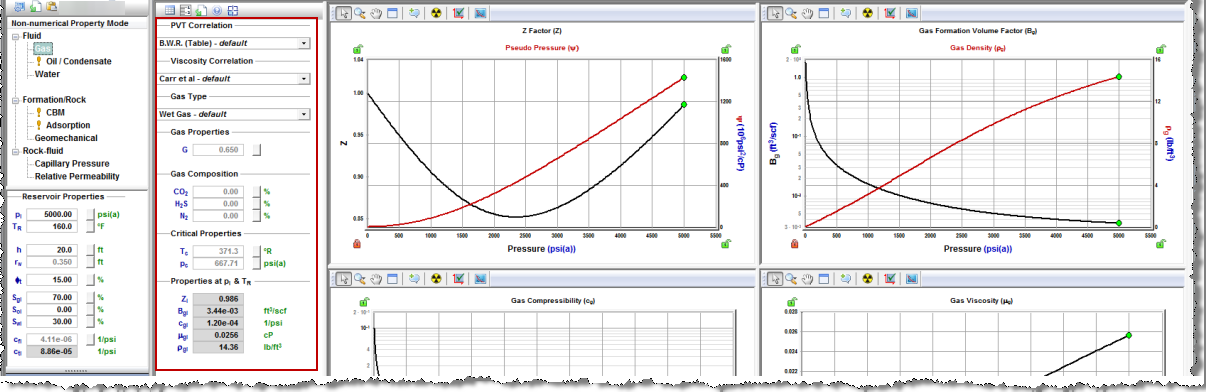
Gas Properties
This view displays drop-down lists where you can select the PVT correlation (for Z, Bg, and cg) and viscosity correlation.
| Note: | Unless otherwise noted, all percentages are in mole %. |
From the Gas Type drop-down list, you can select one of the following gas types: dry gas, wet gas, or liquid-rich gas. When liquid-rich gas is selected, an additional drop-down list and gas property inputs is displayed. The Vaporized Oil Ratio (Rs) Correlation drop-down list is used to model liquid drop-out in the Gas Condensate Numerical models. To calculate a recombined gas rate factor and a recombined gas gravity (used in analytical modeling of gas condensate reservoirs), enter the initial condensate gas ratio (CGR), condensate gravity, and separator temperature and pressure to be used with gas gravity. For additional information, see Gas Condensate Properties.
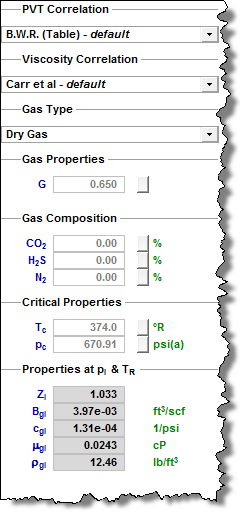
After you select Gas in the selection tree, you can select a PVT correlation or custom table from the PVT Correlation drop-down list. (If you select Custom Table, you can enter your own data.) In the Viscosity Correlation drop-down list, you can select a viscosity correlation or a custom table. In the Gas Type drop-down list, you can select dry gas, wet gas, or liquid-rich gas. These selections affect how gas properties are calculated.
Gas Properties, Gas Composition, and Critical Properties can be entered as input parameters in each of their sections. The calculated properties at pi and TR are also displayed.
Gas properties vs pressure are plotted, including Z, ψ, Bg or Bgd, ρg, cg, Rv, VL / Vsat, and μg.
Additional Properties for Liquid-rich Gas
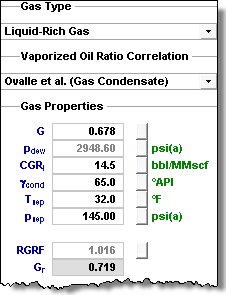
If the Gas Type is set to Liquid-Rich Gas, additional properties are displayed:
- Vaporized Oil Ratio Correlation — defines the amount of liquid vaporized in gas as a function of pressure.
- pdew — dew point pressure. It should be set to the same value as the bubble point pressure defined under Oil / Condensate properties.
- CGRI — condensate gas ratio at the separator.
- γcond — condensate gravity. It should be set to the same value as the oil gravity defined under Oil / Condensate properties.
- Tsep, psep — temperature and pressure at the separator.
- RGRF — recombined gas rate factor. We recommend keeping the default value.
- Gr — recombined gas gravity. All gas property functions are generated based on this gas gravity (as well as critical temperature and pressure).
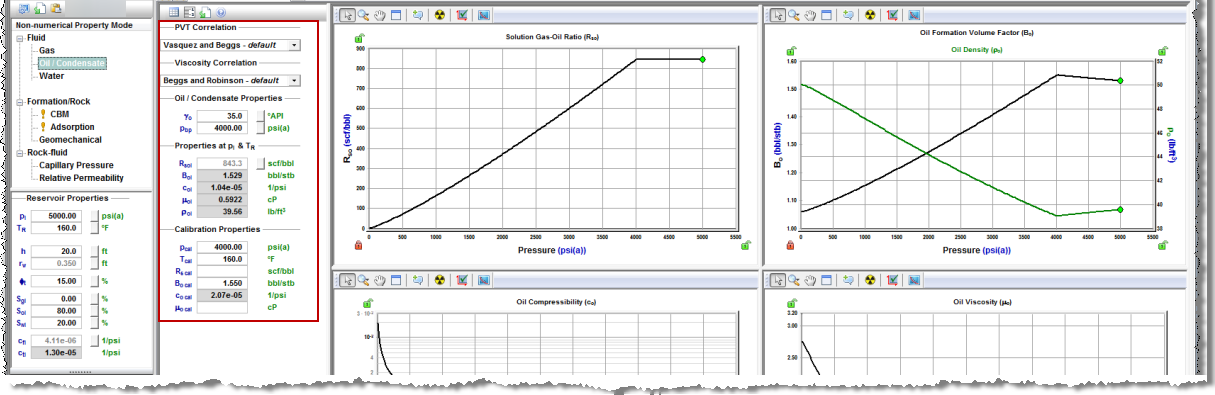
Oil / Condensate Properties
This view displays drop-down lists where you can select the PVT correlation (for Rso, Bo, and co) and viscosity correlation.
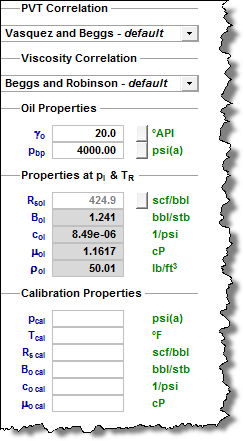
If the available correlations do not describe your oil properties satisfactorily, you can select custom correlations, and import or paste custom PVT data into tables for Rs, Bo, and mu. Alternatively, you can calibrate a correlation to shift it through a known PVT point by populating the inputs in the Calibration Properties section of the Oil Inputs pane. When calibrating an oil correlation, check all the plots to ensure that the resulting properties make sense. For example, if unrealistic values are entered for Rso and Bo, the oil compressibility curve, which is calculated from the Rso and Bo curves, may contain discontinuities. See Oil Calibration for more information.
After you select Oil / Condensate in the selection tree, you can select a PVT correlation, constant properties, or custom table from the PVT Correlation drop-down list. In the Viscosity Correlation drop-down list, you can select a correlation, constant properties, or custom table.
Oil properties can be entered as input parameters. The calculated properties at pi and TR are also displayed. Calibration properties can be entered to calibrate your oil / condensate properties.
Oil properties vs pressure are plotted, including Rso, Bo, ρo, co, and μo.
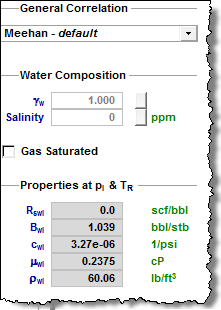
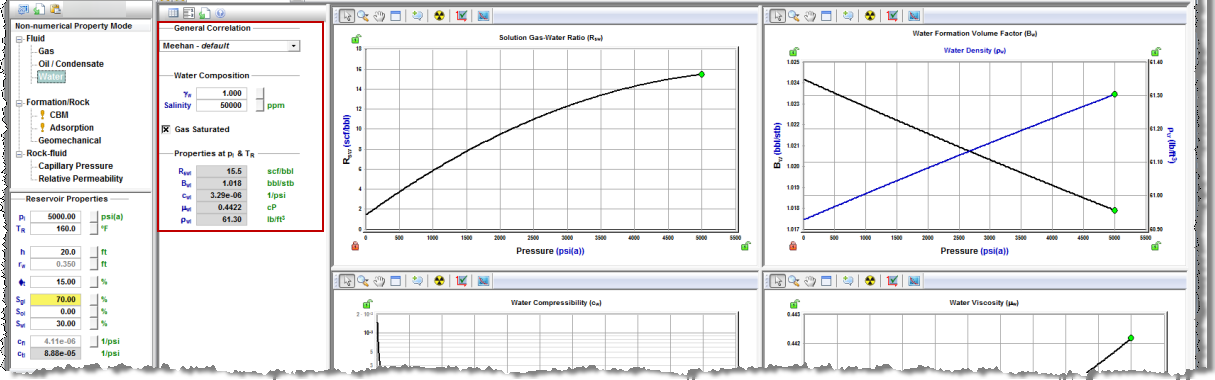
Water Properties
This view displays a drop-down list and fields where you can enter your water properties.
 .
.
After you select Water in the selection tree, you can select a correlation, constant properties, or custom table from the General Correlation drop-down list.
You can enter Water Composition as input parameters, and you can select the Gas Saturated checkbox to take into account gas saturation in water. The calculated properties at pi and TR are displayed.
Water properties vs pressure are plotted, including Rsw, Bw, ρw, cw, and μw.
CBM Properties
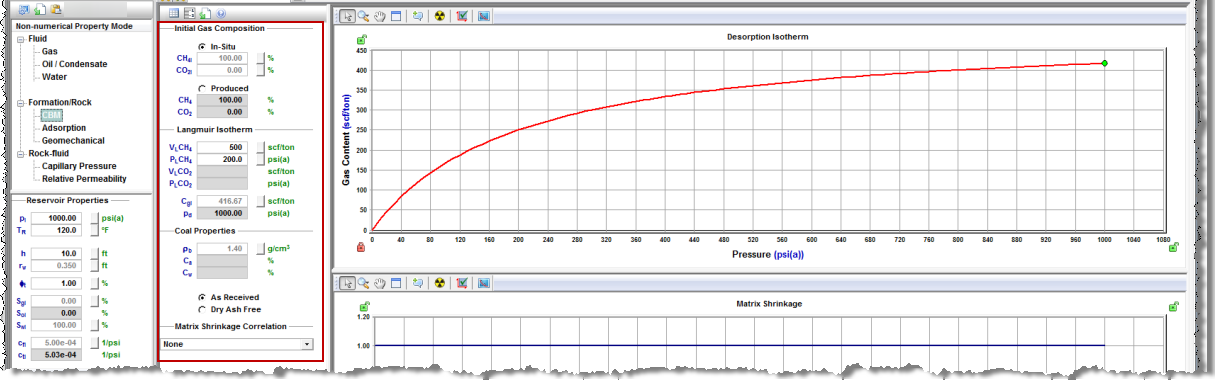
WellTest supports coalbed methane (CBM) analytical models (appropriate for dry CBM wells) and numerical models (for wet or dry CBM wells). The pseudo-steady state (PSS) models, designed to model wet CBM wells analytically, are available in IHS HarmonyTM, but not in WellTest. The Initial Gas Composition section of the CBM Inputs pane only impacts the PSS models and has no impact on WellTest.
Enter the Langmuir Isotherm and Coal properties to account for the gas adsorbed on the coal.
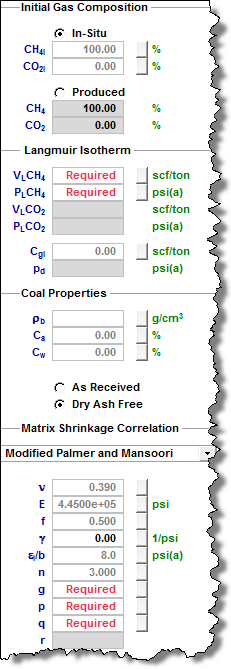
After you select CBM in the selection tree, Initial Gas Composition, Langmuir Isotherm, and Coal Properties can be entered as input parameters. In the Matrix Shrinkage Correlation drop-down list, you can select a correlation or custom table.
CBM properties vs pressure are plotted, including Gas Content, k / ki, and Φ / Φi.
Adsorption Properties
Adsorption properties should be entered to account for adsorbed gas in shales. For adsorption in CBM reservoirs, the CBM properties should be populated.
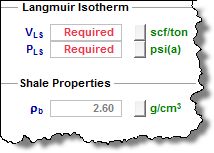
After you select Adsorption in the selection tree, Langmuir Isotherm, and Shale Properties can be entered as input parameters.
Gas content vs pressure is plotted.

Geomechanical Properties
With geomechanical properties, you can model pressure-dependent permeability and formation compressibility, which are significant in over-pressured reservoirs such as the Haynesville shale.
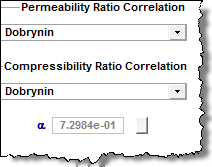
After you select Geomechanical in the selection tree, you can select a correlation or custom table from the Permeability Ratio Correlation drop-down list. In the Compressibility Ratio Correlation drop-down list, you can select a correlation or custom table.
Geomechanical properties vs pressure are plotted, including k / ki and cf / cfi.
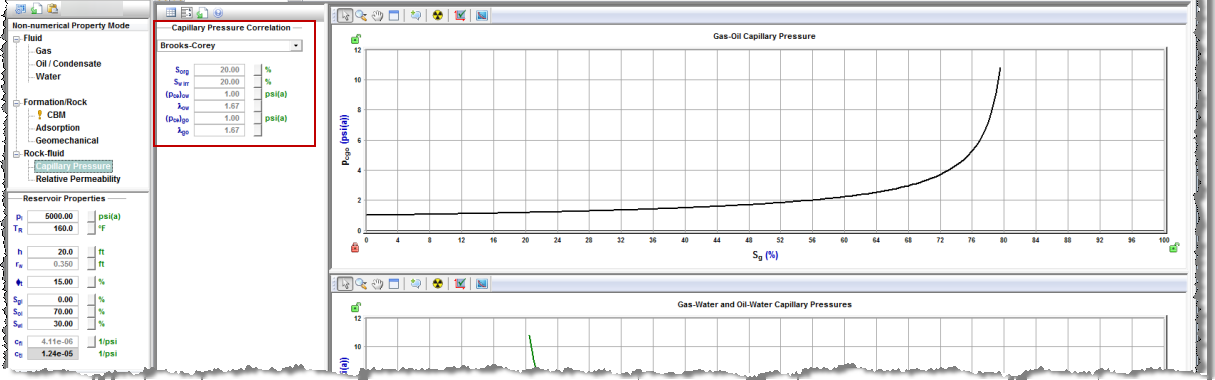
Capillary Pressure Properties
Capillary pressure properties are used by numerical models.
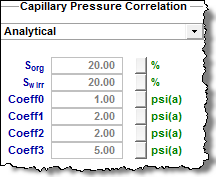
After you select Capillary Pressure in the selection tree, you can select a correlation or custom table from the Capillary Pressure Correlation drop-down list.
Capillary pressures vs pressure are plotted, including pcgo, pcgw and pcow.
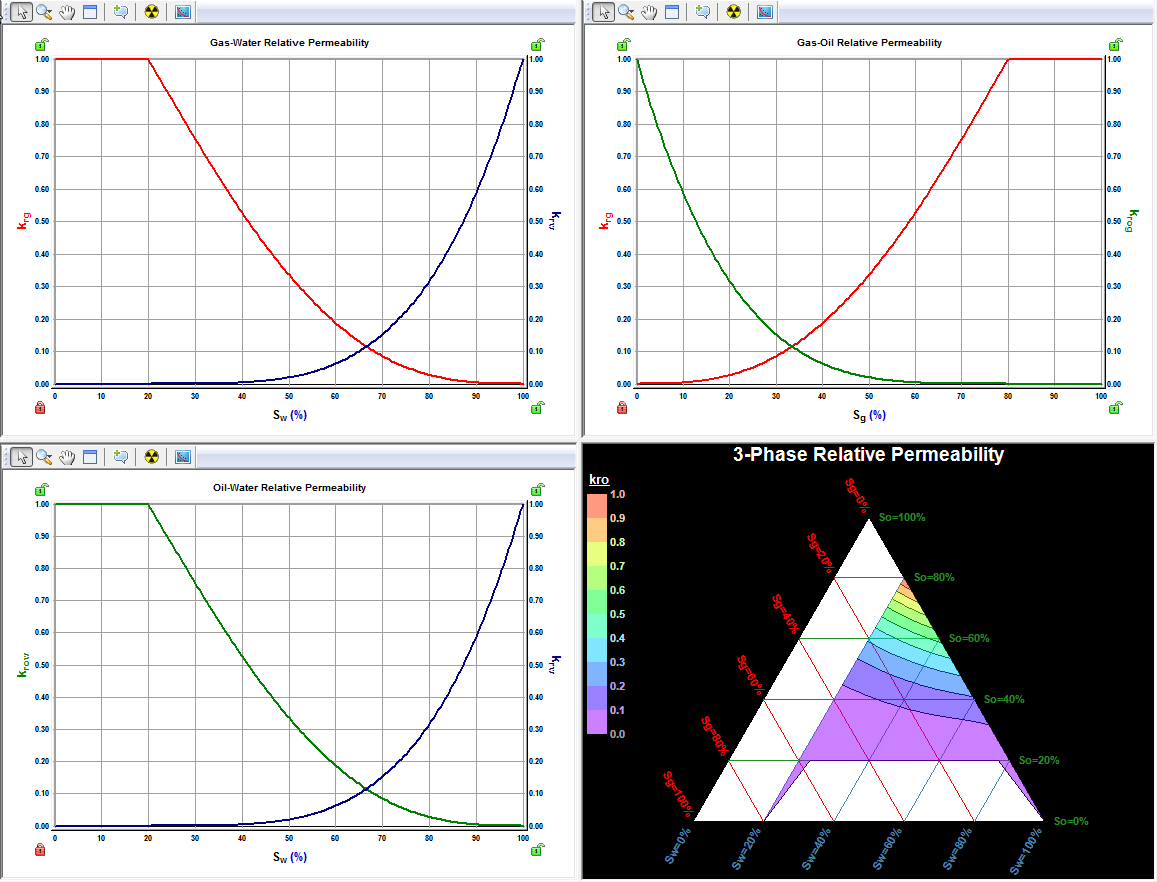
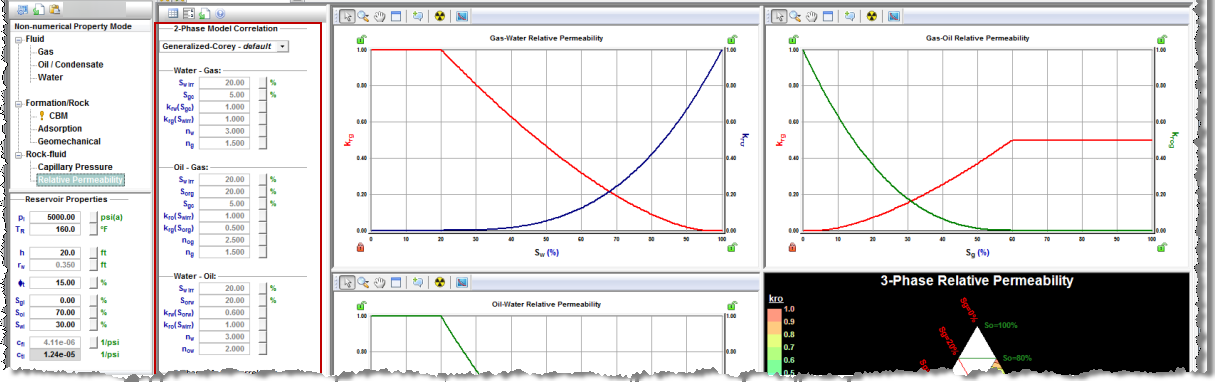
Relative Permeability Properties
Relative permeability properties are used by numerical models.
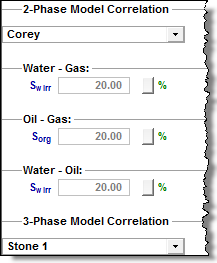
After you select Relative Permeability in the selection tree, you can select a correlation or custom table in the 2-Phase Model Correlation drop-down list. You can enter input parameters for water-gas, oil-gas, and water-oil. In the 3-Phase Model Correlation drop-down list, you can select a correlation.
Relative permeabilities vs pressure are plotted for gas-water, gas-oil, and oil-water. The 3-phase relative permeability is also presented in a triangle graph.
Main View
This view consists of plots or tables displaying how properties vary with pressure or saturation, and depends on the property type selected in the Property Type view. To switch between viewing plots or tables, click the View Data or View Plot icons on the toolbar of the Inputs pane.
| Note: | The tables are read-only unless a Custom correlation is selected in the Inputs pane. |