Minifrac Pre-Closure Analysis
Subtopics:
Tangent Method Pre-Closure Analysis
Compliance Method Pre-Closure Analysis
Permeability Evaluation (Compliance Method)
Instantaneous Shut-In Pressure
Introduction
The analysis of minifrac test data is performed in two parts: pre-closure analysis (PCA) and after-closure analysis (ACA).
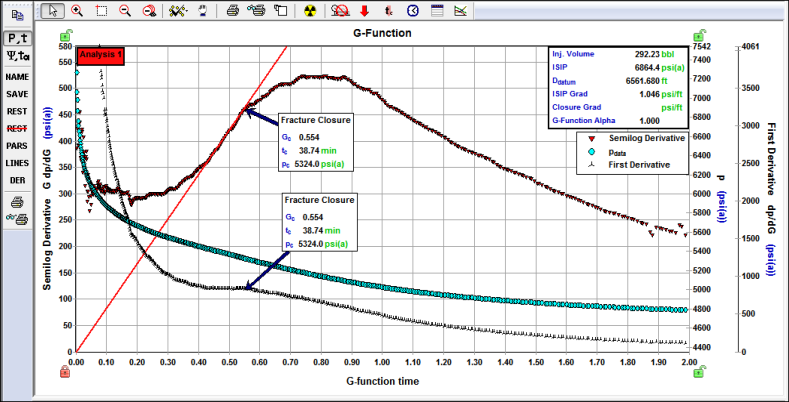
Pre-closure analysis consists of identifying closure and analyzing the early pressure falloff period while the induced fracture is closing. One of the most critical parameters in fracture treatment design is the closure pressure. One specialized analysis technique used to identify closure is, in pressure transient parlance, the G-Function Analysis.
The following parameters are determined from the PCA:
- Fracture closure pressure (pc)
- Instantaneous Shut-In Pressure (ISIP) = Final injection pressure - Pressure drop due to friction
- ISIP Gradient = ISIP / Formation Depth
- Closure Gradient = Closure Pressure / Formation Depth
- Net Fracture Pressure (Δpnet) – Net fracture pressure is the additional pressure within the fracture above the pressure required to keep the fracture open. It is an indication of the energy available to propagate the fracture.
- Δpnet = ISIP - Closure Pressure
- Fluid
efficiency – Fluid efficiency is the ratio of
the stored volume within the fracture to the total fluid injected. A high
fluid efficiency means low leakoff and indicates the energy used to inject
the fluid was efficiently utilized in creating and growing the fracture.
Unfortunately, low leakoff is also an indication of low permeability.
For minifrac after-closure analysis, high fluid efficiency is coupled
with long closure durations and even longer identifiable flow regime trends

- Gc is the G-function time at fracture closure
- Formation leakoff characteristics and fluid loss coefficients.
G-Function Analysis
G-function (also called G-time) was initially introduced by Nolte (1979). The G-function is a dimensionless time function designed to linearize the pressure behaviour from a bi-wing fracture and under reasonable assumptions is proportional to cumulative leakoff after shut-in. Post-injection (pre-closure) pressure falloff analysis can be performed using the Tangent Method (G-function and Square root time plots) and Compliance method (G-function plot) in WellTest.
Algebraic Definition of the G-Function
The G-function is a dimensionless time function relating shut-in time (t) to total pumping time (tp) at an assumed constant rate.
The basic G-Function calculations are based on the following equations:


Two limiting cases for the G-function are shown here:
- The equation for α = 1.0 is for low leakoff, or high efficiency where the fracture area open after shut-in varies approximately linearly with time.
- The equation for α = 0.5 is for high leakoff, or low efficiency fluids where the fracture surface area varies with the square-root of time after shut-in.
- The value of g0 is the computed value of g at shut-in.
One of the key variables identified by Nolte is the difference between a high efficiency (upper limit) and a low efficiency (lower limit) leak-off condition. These two conditions have no significant effect on the overall shape of the curves.
Tangent Method Pre-Closure Analysis
A straight-line trend of the G-function Semi-log derivative (G dp/dG) is expected where the slope of the derivative is still increasing. Positioning the Fracture Closure identification line, which is anchored to the origin by default, through the straight-line portion of the G-Function Semi-log derivative. Fracture closure is identified as the point where the G-Function Semi-log derivative starts to deviate away from the straight line, this technique is often referred as Tangent Method (Barree et al. 2007), as shown in the following figure.
During normal fluid leakoff semi-log derivative data falls on the straight line and any deviations from this straight-line behaviour can be used to characterize other leakoff mechanisms. The Square root time plot exhibits similar behavior and can be used to support the Tangent method.
Square Root Time Analysis
Fracture closure can be identified by the peak of the first derivative on the MiniFrac sqrt(t) plot, which corresponds to an inflection point on the pressure curve. The semi-log derivative behaves similar to the semi-log derivative on the G-Function Analysis. A user-defined (Sqrt(t)) analysis line may be added to the MiniFrac Sqrt(t) plot to help identify the point of inflection.
.png)
Fluid Leakoff Types
The G-Function plots for four common leakoff types and the corresponding identification of fracture closure pressure are described in the following section:
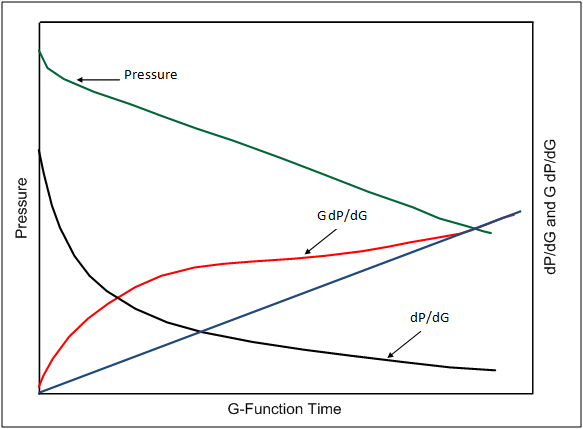
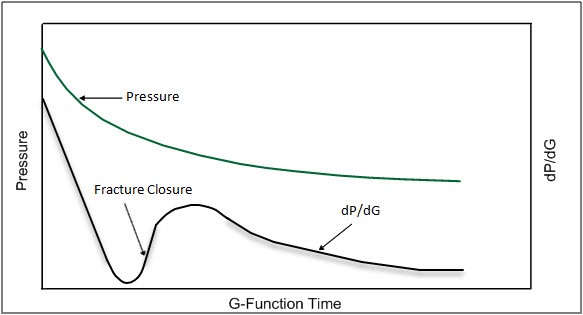
Normal Leakoff
Normal leakoff occurs when the fracture area is constant during shut-in and the leakoff occurs through a homogeneous rock matrix.
Two characteristics are visible on the G function curve:
- A constant pressure derivative (dP/dG) during fracture closure.
- The G-Function semi-log derivative (G dP/dG) lies on a straight line that passes through the origin.
The fracture closure point can be identified when the G-Function semi-log derivative (G dP/dG) starts to deviate away from the straight line. The time and pressure corresponding to this point are identified from a marker set at this point.

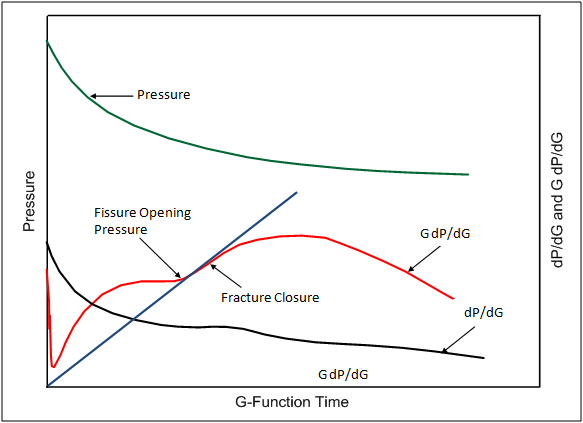
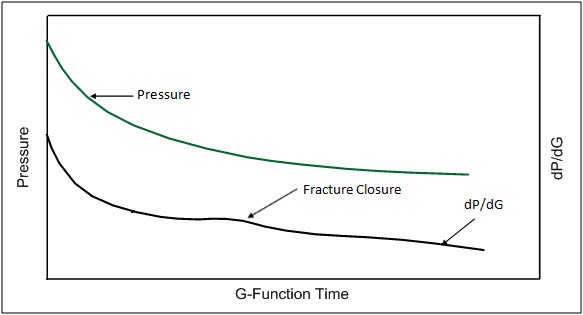
Pressure-Dependent Leakoff
Pressure-dependent leakoff (PDL) indicates the existence of secondary fractures intersecting the main fracture, and is identified by a characteristic “hump” in the G-Function semi-log derivative that lies above the straight line fit through the normal leakoff data. This hump indicates fluid is leaking off faster than expected for a normal bi-wing fracture. The interception of secondary fractures, which could be natural or induced, facilitates this additional leakoff by providing a larger surface area exposed to the matrix.
The characteristic signatures of PDL are:
- A characteristic large “hump” in the G-Function semi-log derivative; G dP/dG lies above the straight line that passes through the origin.
- Subsequent to the hump, the pressure decline exhibits normal leakoff.
- The portion of the normal leakoff lies on a straight line passing through the origin.
- The end of the hump is identified as “fissure opening pressure”.
As shown below, the fracture closure point is identified from the G-Function semi-log derivative G dP/dG when it starts to deviate away from the straight line.
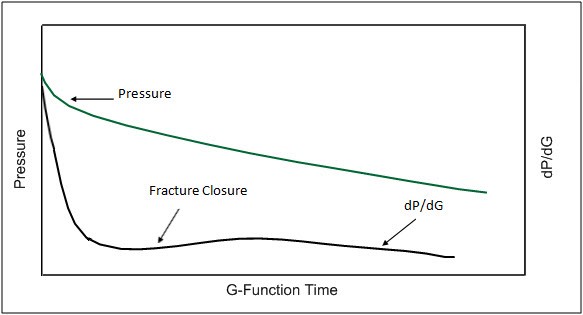
Transverse Storage / Fracture Height Recession
The G-Function semi-log derivative G dP/dG can also fall below a straight line that extrapolates through the normal leakoff data, exhibiting a concave up-trend. This indicates fluid is leaking off slower than expected for a normal bi-wing fracture and suggests that the fracture has some pressure support. Two scenarios can explain this trend as discussed below.
1. Transverse storage occurs when the main fracture intercepts a secondary fracture network, which could be natural or induced. This differs from PDL in that the dominant effect of the secondary fractures is to provide pressure support to the main fracture, rather than additional surface area for leakoff. There can be cases where transverse storage (pressure support) dominates, followed by a period of PDL before closure of the main fracture occurs.
2. Fracture height recession occurs if the fracture propagates through adjoining impermeable layers (above or below the pay zone) during injection. In the normal leakoff scenario, fluid can leak off from the entire surface area of the fracture. For fracture height recession, leakoff can only occur in the portion of the fracture which is in communication with the permeable zone. As a result, the leakoff rate is slower than the normal case. Eventually, the fracture area in the impermeable layer(s) starts closing (height recession), and during this period the rate of pressure decline increases. After the fracture height recedes to the edge of the permeable zone, the entire area of the fracture contributes to leak off, and a period of normal leakoff ensues.
The three characteristic signatures for height recession during shut-in are:
- The G-Function semi-log derivative G dP/dG lies below a straight line extrapolated through the normal leakoff data.
- The G-Function semi-log derivative G dP/dG exhibits a concave up trend.
- The First Derivative dP/dG also exhibits a concave up trend.
![]()
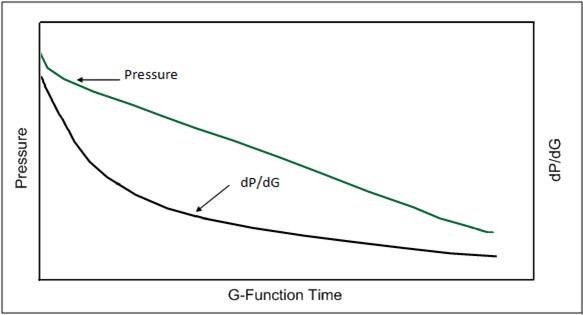
Fracture Tip Extension
Fracture tip extension occurs when a fracture continues to grow even after injection is stopped and the well is shut-in. It is a phenomenon that occurs in very low permeability reservoirs, as the energy which normally would be released through leakoff is transferred to the ends of the fracture resulting in fracture tip extension.
The characteristic signatures for a fracture tip extension are:
- The G-Function semi-log derivative G dP/dG initially exhibits a large positive slope that continues to decrease with shut-in time, yielding a concave-down curvature.
- Any straight line fit through the G-Function semi-log derivative G dP/dG intersects the y-axis above the origin.
Until the main fracture closes, the G-Function semi-log derivative behaves similarly to PDL, and it is difficult to distinguish between PDL and fracture tip extension. The following plot shows a typical response for fracture tip extension after shut-in.
Compliance Method Pre-Closure Analysis
Fracture Compliance method or commonly known as compliance method is a technique to estimate stress, permeability, and pore pressure via identifying the closure or contact point using First Derivative (dp/dG) on the G-function plot based on the work of McClure et. al (2014, 2016, 2019).
Initially, First Derivative decreases as near wellbore pressure drop effect dissipates and as soon as the fracture walls come into contact it causes an increase in the First Derivative trend due to rapidly decreasing system storage coefficient. As pressure continues to drop, the Carter leakoff assumption of constant fracture pressure is no longer valid and the transient transitions into impulse linear or radial. This deviation from Carter leakoff causes the actual leakoff rate to decrease relative to the prediction by the G-function, which is why the First Derivative peaks and then decreases.
In an ideal “S” shaped First Derivative (dp/dG) with distinct min/max, it’s easier to identify the closure. Closure can be picked when First Derivative roughly increases by 10% from the minimum value on the First Derivative. However, estimating minimum principal stress (Shmin) is a bit challenging as there is no evident signal in the transient data when pressure is equal to minimum principal stress. Fracture roughness and aperture not being equal to zero at contact creates a back stress, thus the difference between closure pressure and the true value of Shmin is uncertain. Since the closure pressure value is close to and slightly larger than Shmin during Minifrac, Shmin can be evaluated using closure pressure. McClure et. al performed match of Minifrac field simulations and found subtracting approximately 75 psi from closure pressure is a good rule of thumb, however it is a source of uncertainty and an inherent limitation of the Minifrac data.
Besides the distinct “S” shape, First Derivative demonstrates different trends including subtle change in the minimum and maximum to monotonic decreasing dp/dG, hence signatures are broadly divided into three categories:
1. Ideal Signature
2. Adequate Signature
3. Non-ideal Signature
Ideal Signature
First Derivative (dp/dG) makes a typical “S” shape with a clear minimum and maximum making it easier to identify the closure and Shmin as shown in the plot. After identification of the minimum dp/dG, closure is picked roughly 10% above the minimum value.
Adequate Signature
In these trends First Derivative doesn’t show the typical “S” shape trend with not as clear min/max in the data. However, closure and stress estimates can be interpreted with adequate certainty using the inflection point in the First Derivative trend. Plot below indicates an example of it, where First Derivative decreases and reaches a plateau then inflects downward with a continuous monotonic decreasing trend. Closure can be picked at the inflection point and stress estimates can be evaluated accordingly.
Here's another example of adequate signature shown in the following plot, where it’s even more difficult to identify the contact as after initial decrease in the First Derivative trend it reaches a minimum and slightly inflects upward and stays mostly flat rather than decreasing. This deviation from the typical ideal signature could possibly be explained by significant effect of near wellbore tortuosity impacting the transients from revealing fracture closure.
Non-ideal Signature
First Derivative, in this signature shows a continuous monotonically decreasing trend with no inflection points. Possibly transients being masked by severe near wellbore pressure drop due to tortuosity (horizontal wells), instantaneous closure due to rapid leakoff either injecting into high permeable formation or injection into the existing large fracture/depleted fractures or simply could be due to operational issues. These tests can’t be used to identify fracture closure or make any estimates using compliance method.
H-function
Nolte (1979) derivation of G-function uses Carter leakoff which assumes constant fracture pressure. This assumption is violated as pressure decreases over time during Minifrac. H-function is defined in the same fashion as being proportional to the cumulative volume of fluid leakoff after shut-in but doesn’t assume Carter leakoff via accounting for the changing fracture pressure over time. It is calculated by taking the time-convolutional integral of the constant pressure solution, which is similar to the approach taken by Mayerhofer et al. (1993,1995). Mathematically H-function is given by:

And h-function

Permeability Evaluation (Compliance Method)
Permeability is evaluated assuming either a PKN fracture or Radial fracture geometry in WellTest. G-function and h-function permeabilities are evaluated via writing the mass balance for the entire system during Minifrac. It simply means the injected volume (Vinj)is equal to the summation of wellbore storage, fracture volume and leakoff.
Mass balance using g-function is given by:

Mass balance using h-function is given by:

Where pwf,init is the sandface injection pressure at the initiation of injection, C is the wellbore storage coefficient, CL is the leakoff coefficient, Sf is the fracture stiffness and g(Δt) and h(Δt) are the g and h functions respectively.
WellTest facilitates in estimating the wellbore storage coefficient using the wellbore storage plot in the Compliance method pre-closure analysis worksheet. A plot of pressure vs cumulative water injection prior to breakdown forms a straight line, and the inverse of the slope of such a plot reveals the wellbore storage coefficient.
Pre-closure estimates of permeability are found to be statistically higher than after-closure estimates per McClure (2022). G-function permeability is around 2 times and h-function permeability is around 1.5 times higher than impulse linear estimates. Please note WellTest doesn’t account for any correction based on this statistical analysis.
Instantaneous Shut-In Pressure
Instantaneous shut-in pressure (ISIP) is defined as:
-
ISIP = Final injection pressure - Pressure drop due to friction in the wellbore, perforations or slotted liner and tortuosity
ISIP can be a difficult value to quantify and, as a result, there are numerous ways to obtain an estimate of ISIP in WellTest. The Pre-closure Diagnostic (Tangent Method) analysis and the Pre-closure Diagnostics (Compliance Method) analysis allow the user to evaluate ISIP differently.
Using the ISIP plot in the Pre-closure Diagnostic (Tangent Method) analysis, ISIP can be evaluated using the following methods:
-
If sandface pressures have been calculated, a default value for ISIP is calculated by subtracting the friction component of the sandface calculation from the final injection pressure. This tends to overestimate the value of ISIP because it doesn't account for friction through the perforations or near the wellbore pressure drop. ISIP evaluated using this method is commonly referred as the ISIP at the end of pumping or pumping ISIP.
-
It is also common practice to estimate the ISIP by placing a straight line on the early falloff portion of the history plot. After shut-in, the friction decreases rapidly and this can appear to cause a step drop in pressure, or a brief linear trend in the data (prior to the expected concave-up-trend of the falloff). The ISIP evaluated using this method is possibly accounting for the pressure drop due to friction in the wellbore but pressure drop due to tortuosity beyond the wellbore is not accounted for and the resultant value of ISIP possibly could be on the higher side than the fracture pressure upon shut-in. McClure et al. (2019) have termed it as literal ISIP.
-
If a closure arrow is placed on the G-function plot, ISIP can also be calculated from the following equation, which assumes normal leakoff.

Using the G-function plot in the Pre-closure Diagnostic (Compliance Method) analysis, ISIP can be evaluated by the technique suggested by McClure et. al (2019) calling it Effective ISIP (ISIPeff). It is also known as far-field ISIP as it is an estimate of fracture pressure in the far-field at shut-in, meaning it is accounting for all the pressure drop due to friction, perforations and tortuosity etc. Effective ISIP is identified by linear extrapolation from the pressure data at min. dp/dG to y-intercept at zero G-time in the G-function plot.
Fracture Closure Pressure
Fracture closure pressure is the fluid pressure needed to initiate the opening of a fracture. This is not the same as the breakdown pressure, which is the fluid pressure required to initiate a fracture in intact rock.
Closure pressure is equal to the minimum in-situ stress because the pressure required to open a fracture is the same as the pressure required to counteract the stress in the rock perpendicular to the fracture. Closure pressure is determined from the G-Function or the Sqrt(t) plot.