AccuLogs® is S&P Global software for viewing and picking tops on logs, and creating and managing cross sections. Using AccuLogs, you can view current log data for Western Canada and Northwestern United States to quickly create a cross section that would otherwise take hours to create by hand.
How you can use AccuLogs
- Use AccuLogs to view and work with logs for a single well using AccuLogs Viewer, or use AccuLogs Cross Section to view and work with logs for a cross section.
- Both AccuLogs Viewer and AccuLogs Cross Section enable you to do the following:
- Import proprietary digital or raster logs
- Pick tops and save them back to AccuMap for creating contour maps
- View test and completion symbols automatically annotated on logs
- Filter logs to clean up raster images
- Annotate logs by adding text, lines, and shapes to emphasize important features and interpretations
- Add contact types and, if using AccuLogs Cross Section, lithological fills
- Print standard or custom scales
- Create copies of a cross sections using stratigraphic or structural datums, interpretations, etc. to evaluate different geological models
- Create typelogs to compare to other wells and fine-tune correlations
- Paste Excel spreadsheets, Word documents, and AccuMap maps, data cards, graphs, etc., onto a cross section to create a more complete interpretation
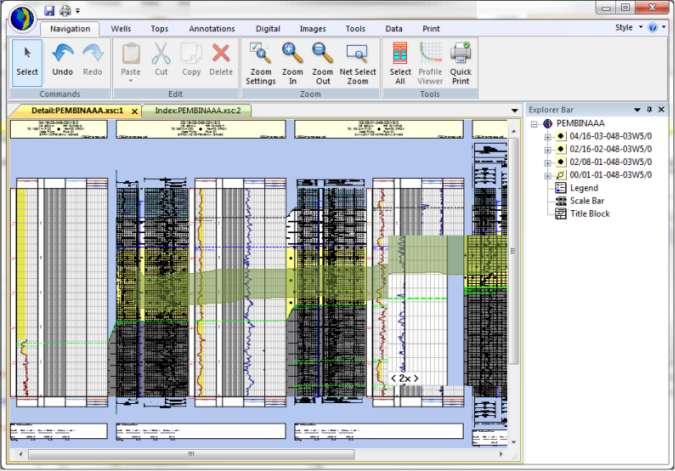
Here is a structural cross section complete with correlations, lithological fills, and annotations created in AccuLogs.
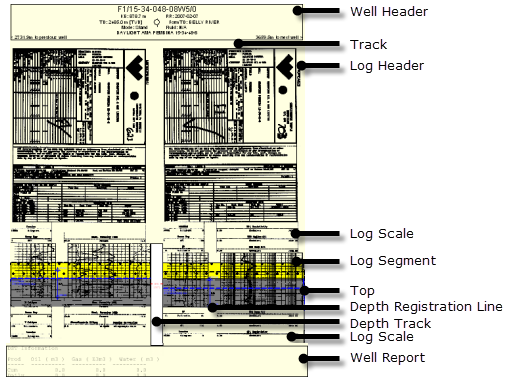
AccuLogs displays the following components:
About the S&P Global Log Database
AccuLogs uses both raster and digital log images. Raster images are essentially scanned pictures of the original logs. Digital logs are the numeric log readings that are stored in LAS files. Raster log images are available in both measured depth (MD) and true vertical depth (TVD) format. Digital logs are only available in MD format. Where both raster and digital logs are displayed alongside each other for a deviated well, horizontal misalignment of the logs may occur.